Integrations > Tallyfy Analytics
Tallyfy Analytics is an add-on that replicates your workflow data into a private Amazon Athena…
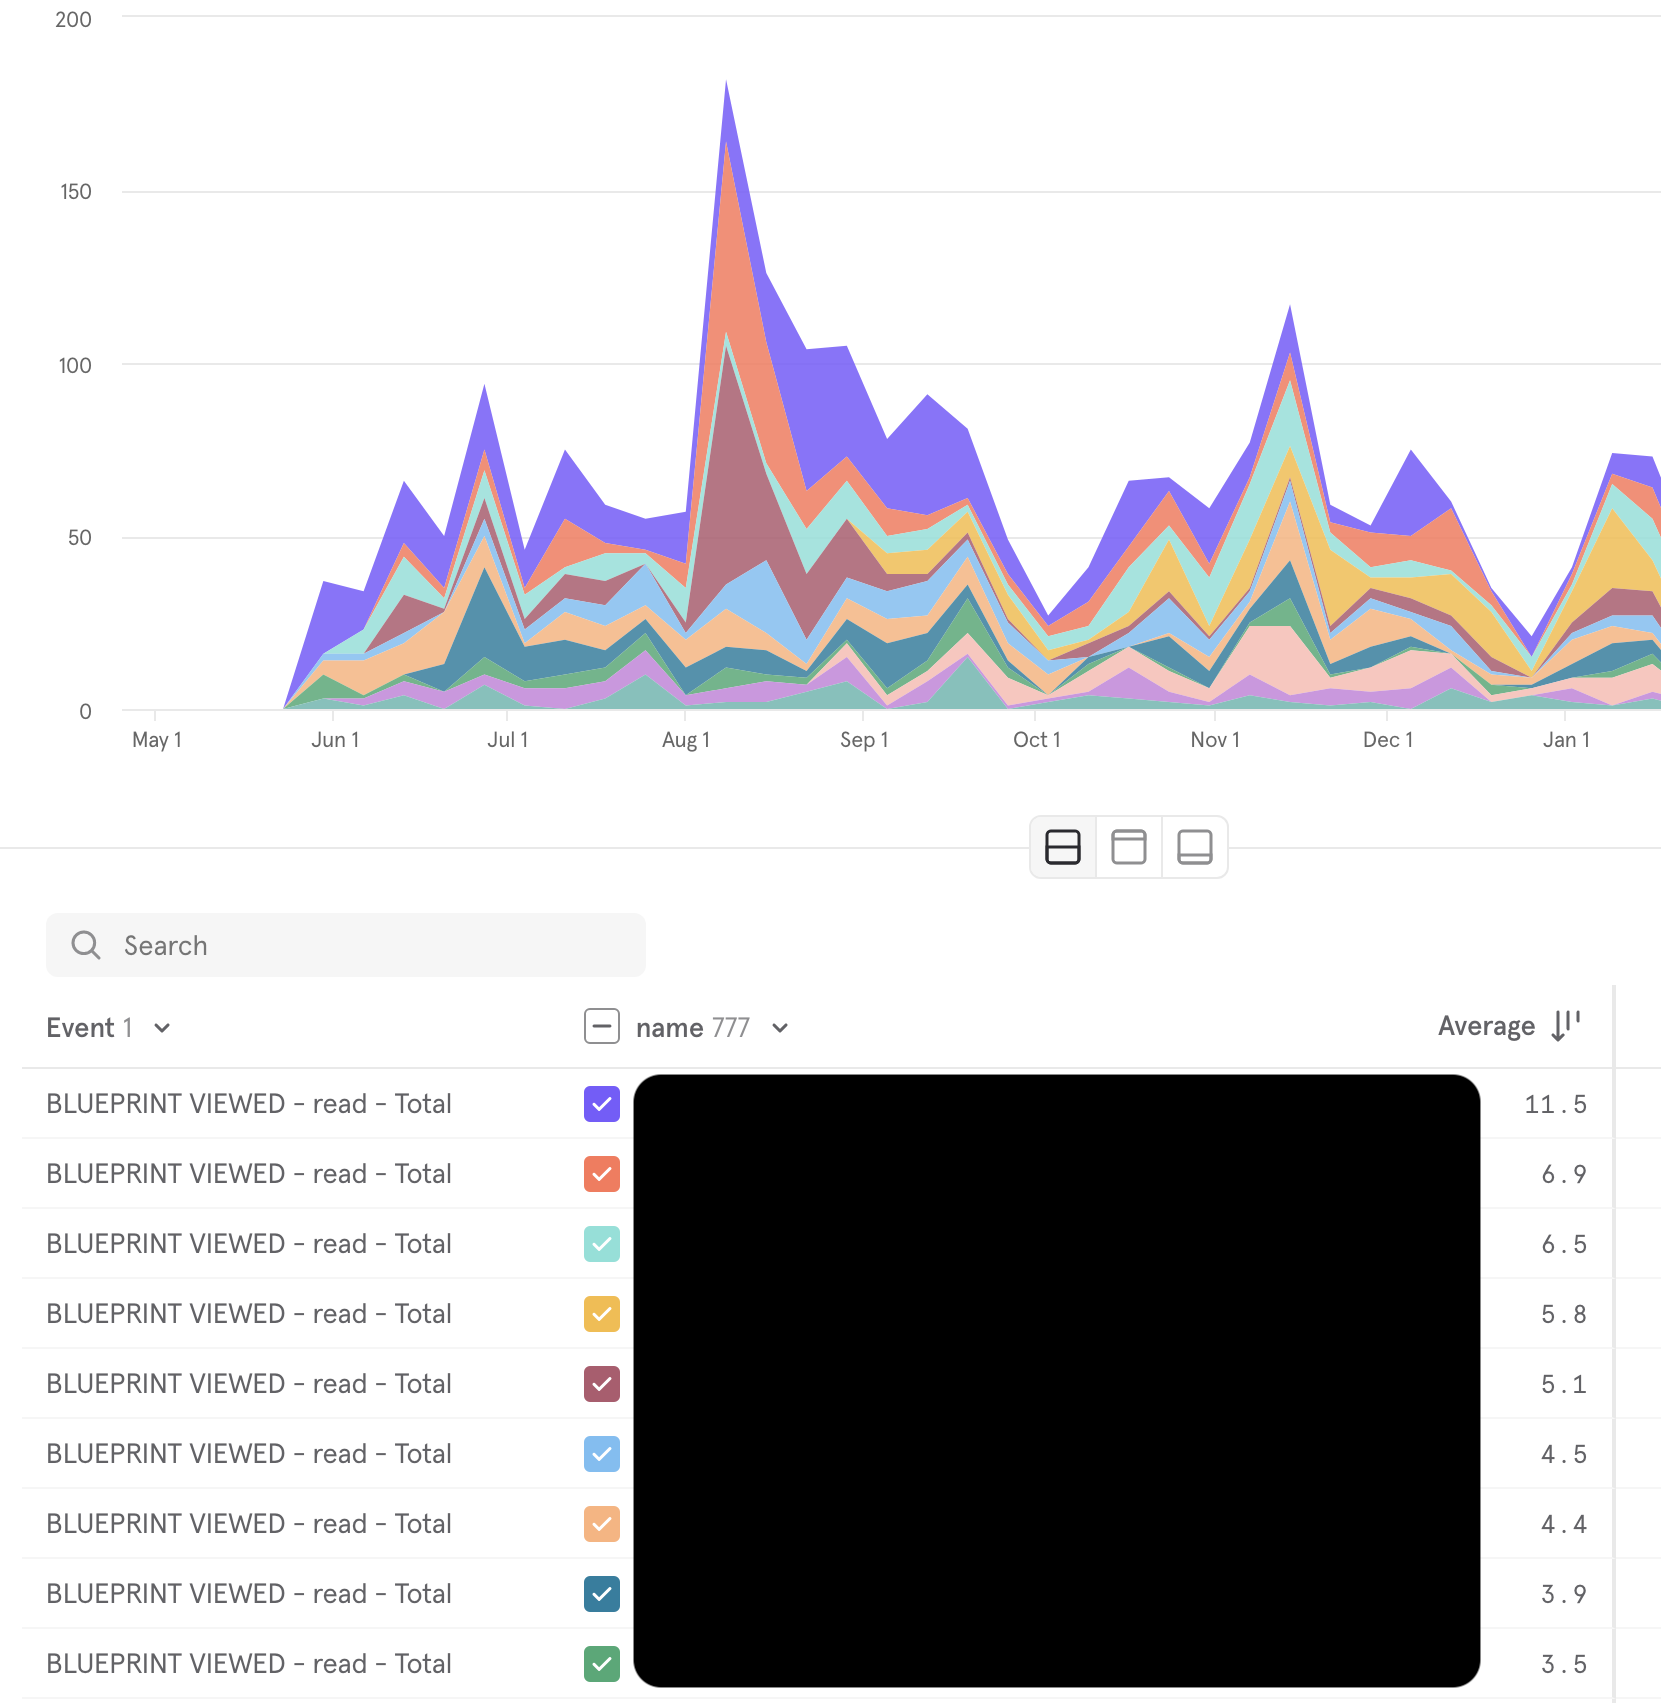
Tallyfy can send usage data directly to your own Google Analytics (GA4) or Mixpanel account. Paste your Measurement ID or project token, and you’ll see how your team interacts with templates, processes, and tasks, right inside your analytics dashboards.
This works for both internal members and guests1.
G-XXXXXXXXXX)That’s it. Tallyfy starts sending page views and events to your GA4 property.
Tallyfy automatically sends events enriched with custom dimensions2 including:
| Dimension | Event Parameter | Description |
|---|---|---|
| Organization ID | orgId | Your Tallyfy organization |
| Task ID | taskId | Specific task being viewed |
| Process ID | processId | Active process instance |
| Template ID | blueprintId | Template being accessed |
| Template Step ID | blueprintStepId | Specific step in a template |
Each event also includes user context (user ID, email, role) and session details automatically. You can create custom dimensions in GA4 under Admin > Data display > Custom definitions to surface these parameters in your reports.
Tallyfy sends a user_id with every event, which means GA4 can track the same person across their laptop, phone, and tablet. Go to Admin > Reporting identity in GA4 to configure how it identifies users: blended, observed, or device-based.
Mixpanel captures the same events Tallyfy sends to GA4, including:
Mixpanel also receives user profile data (name, email, role) and organization context, so you can build user-level funnels and cohort analysis.
Once connected, both Google Analytics and Mixpanel let you:
Integrations > Tallyfy Analytics
Mcp Server > Tallyfy MCP server with Google Gemini
Process Improvement > Gather data and use Tallyfy Analytics
Analytics > How Tallyfy Analytics works