Tallyfy Analytics transforms your workflow data into a format that BI tools like Power BI and Tableau can query directly. Here’s how your data travels from Tallyfy to those tools.
Overview of the data pipeline
Your data goes through five steps to become analytics-ready:
Detecting an event - Tallyfy watches for changes like task completions, process status updates, and user changes.
Extracting the data - Tallyfy captures a complete snapshot of the process where the event occurred.
Converting the format - Tallyfy converts the data to Apache Parquet1 for fast, compressed analysis.
Storing securely - Everything lands in your private Amazon S3 storage bucket.
Providing access - You receive AWS credentials to connect your BI tools.
How the pipeline works in detail
1. Spotting an event
Tasks get completed. Statuses change. Forms get submitted. Processes are created, archived, or restored. When these actions happen in Tallyfy, the system queues them for analytics processing.
2. Getting the data
Each queued event triggers a full process snapshot. The export captures:
Process metadata (owner, status, template name/version, tags, completion timestamps)
Every task’s status, assignees, and due dates
Form field questions and answers
User and guest assignments (including group-based assignments)
Comments and reported issues
Tallyfy initially saves this data as a CSV file.
3. Changing the format
CSV alone won’t cut it for serious analytics. Tallyfy automatically converts it to Apache Parquet format using snappy compression, which:
Queries much faster than raw CSV files
Takes up significantly less storage space
Works natively with Power BI, Tableau, and other BI tools
4. Storing safely
Your Parquet files land in a dedicated S3 bucket:
Each organization gets a private folder - no other accounts can access it
AWS encryption at rest protects stored data
Tallyfy stores both the Parquet files and original CSVs for redundancy
Files stay available throughout your Tallyfy Analytics subscription
5. Allowing access for analysis
Tallyfy provides you with AWS IAM credentials that let your BI tools connect. With these credentials, you can:
Query your data through Amazon Athena2 without managing any database infrastructure
Run SQL queries against your process data
Use standard JDBC/ODBC connections (supported by virtually every BI tool)
Build dashboards and reports on top of the queried data
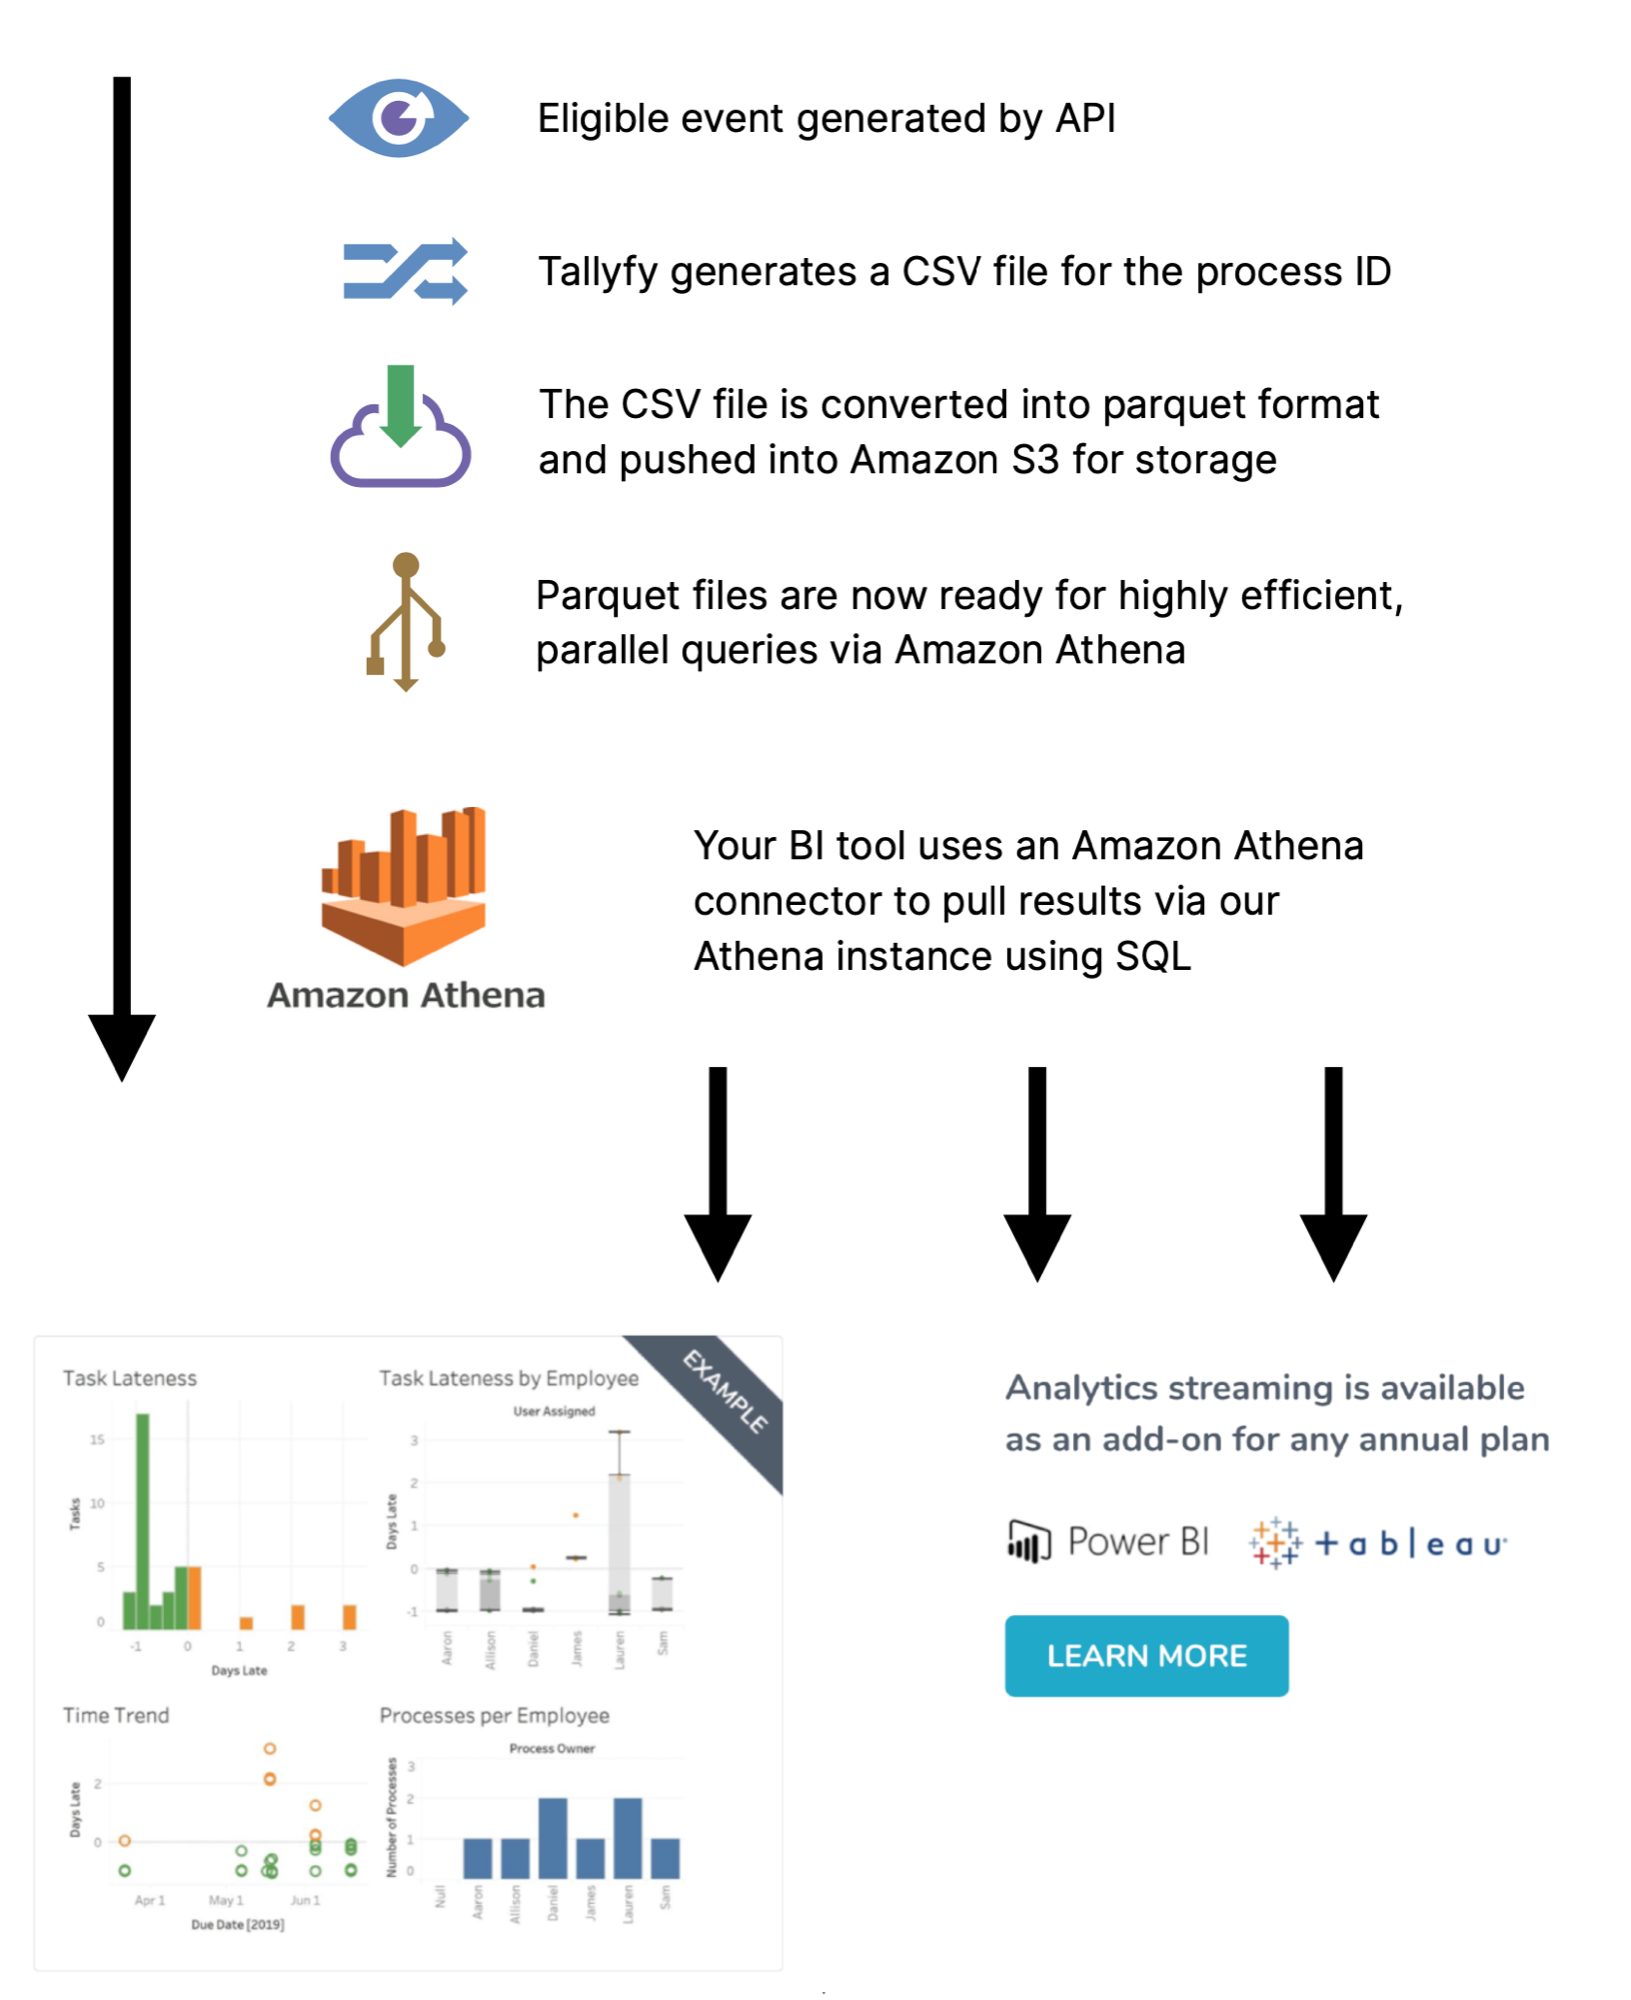
Technical diagram
This diagram shows the complete data flow:
Activating analytics
A few things to know before you start:
Data processing doesn’t begin until you activate Tallyfy Analytics on your account
You’ll receive your AWS IAM credentials right after activation
You can connect most BI tools in about 15 minutes using standard JDBC/ODBC drivers
Need data stored in a specific region or format? Contact Tallyfy support first