Workflow diagram definition and examples
The workflow diagram is a visual representation of your business processes, allowing for easier analysis and process improvement.
Workflow diagrams bring clarity to complex business processes. Here is how Tallyfy approaches workflow visualization and management.
Workflow Made Easy
Summary
- Visual representation using standardized symbols - Workflow diagrams use flowcharts or other formats (SIPOC, swimlane) to show exact process steps and responsible individuals, making business operations transparent and easier to understand, analyze, and improve
- Rooted in scientific management history - Today’s workflow concept traces back to American mechanical engineers Henry Gantt and Frederick Wilson Taylor who contributed to scientific management development, now applicable to any industry with repeatable processes
- Distinct from related process tools - Workflow diagrams are one single process graph (not high-level business process mapping which covers multiple processes, data, systems, and employees), and simpler than business process modeling which includes as-is diagrams plus to-be improvement plans
- Three critical organizational uses - Process analysis identifies weaknesses and improvements through top-down perspective, process instruction combats tribal knowledge loss when key employees leave, tracking and management provides real-time visibility into responsibilities, deadlines, and hold-ups. See how Tallyfy brings workflow diagrams to life
Workflow automation is at the core of what we discuss with organizations at Tallyfy, with employee onboarding alone appearing in over 300 of our customer conversations. In our experience building workflow tools, visualization can be a useful tool for getting a deeper understanding of how your business works. It helps make your processes more transparent, as well as easier to understand and analyze. The workflow diagram is one of the most popular visualization methods - it is simple to design, read, and understand all at the same time.
What is a workflow diagram?
A workflow diagram is a visual representation of a business process (or workflow), usually done through a flowchart. It uses standardized symbols to describe the exact steps needed to complete a process, as well as pointing out individuals responsible for each step.
The “workflow” as we know today can be traced back to two American mechanical engineers, Henry Gantt and Frederick Wilson Taylor. Both were known for their contributions towards the development of scientific management.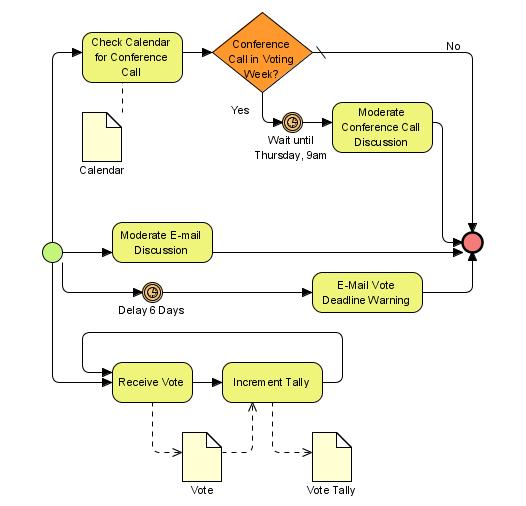 On its own, a workflow diagram is helpful with analysis. By seeing how the business works from a top-down perspective, you can identify its potential flaws, weaknesses, and areas for improvement. In discussions we have had with operations teams, visual diagrams often reveal redundant approval steps that add days to cycle times - one manufacturing team discovered their purchase order process had 7 unnecessary handoffs once they mapped it out.
On top of that, the workflow diagram can be helpful for your employees, as a means of double-checking what needs to be done, who is responsible, etc. It can also be used in combination with process management methodologies, such as Business Process Management (BPM) or Business Process Improvement (BPI).
With a workflow diagram, you identify weaknesses and potential improvements. With the right methodology, you develop potential ideas on how to improve.
Similar tools and terms
Workflows, BPM, mapping, flowcharts, etc. there is a bunch of buzzwords in the industry, so what, exactly, each term means can be a bit confusing.
Here is how the workflow diagram differentiates from similar terms: Flowchart - a workflow diagram can be in the form of a flowchart, but it isn’t necessarily so. It can also be in the form of a SIPOC diagram, swimlane, etc. Business Process Mapping - a workflow diagram is the graphing of one single process.
Business process mapping, on the other hand, is on a much higher level. It can mean mapping out different types of processes, data, systems, as well as the employees involved.
Business Process Modeling - while this does involve using workflow diagrams, it is not exactly the same thing. While the diagram is simply the visualization of a process, modeling means taking the diagram of the process as-is (as in, how the process is right now), finding potential improvements, and creating a to-be (how the process should be in the future).
Workflow diagram use-cases and examples
Initially, workflows were specifically used for manufacturing. Today, however, it can be applied to pretty much any industry, as long as it has some repeatable processes. Generally, it is used for these 3 purposes…
Calculate your process visualization ROI
See how much time your team could save by visualizing and optimizing your workflows.
Are you hearing this at work? That's busywork
Enter between 1 and 150,000
Enter between 0.5 and 40
Enter between $10 and $1,000
Based on $30/hr x 4 hrs/wk
Your loss and waste is:
every week
What you are losing
Cash burned on busywork
per week in wasted wages
What you could have gained
160 extra hours could create:
per week in real and compounding value
Total cumulative impact over time (real cost + missed opportunities)
You are bleeding cash, annoying every employee and killing dreams.
It's a no-brainer
- Process Analysis & Improvement - Through visualization, you get a much more throughout understanding of how a certain business process works.
This information can then be used to find potential weaknesses or improvements. 2. Process Instruction - A lot of the know-how in your company is based on tribal knowledge.
Meaning, if a key employee leaves the organization, the others can get confused on how to carry out a specific process. If you have got it visualized, though, they can just consult the document.
- Tracking & Management - Workflow software, in addition to helping with process mapping, can be used to keep track of the process in real-time. Meaning, you can see who is responsible for what, what is the deadline, whether there are any hold-ups, and so on.
As you could have guessed, all this can be beneficial for any organization, as it is hard to find a company that doesn’t have processes.
Real-life workflow examples
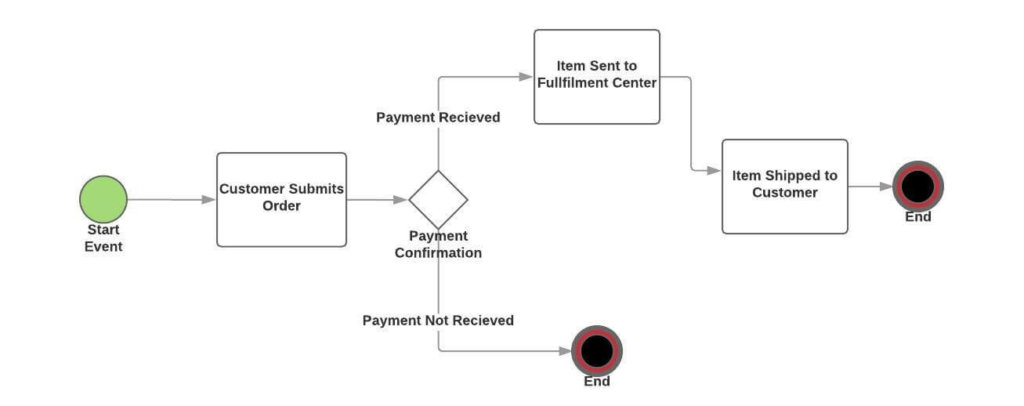
As we have already mentioned, you can use workflows for any industry or process. Here are, however, several industry-specific workflow examples… E-Commerce - The most common use here is tracking an order.
-
Customer submits the order.
-
The transaction is confirmed and money received. 3.
Employee responsible picks up the item and sends it to the fulfillment partner 4. The item is shipped to the customer
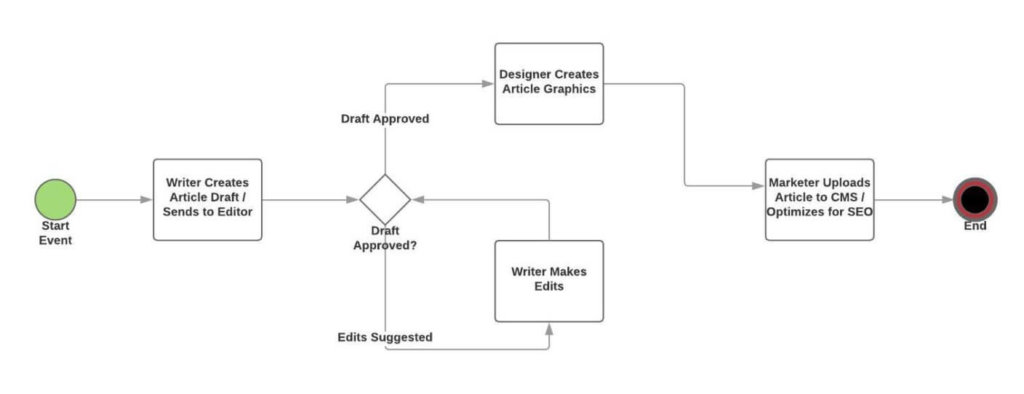
 Content Marketing - In most cases, content marketing can be hectic. It involves the cooperation between the writer, designer, marketer, and potentially several other employees.
- Writer creates a draft of the article and sends it to the editor
- Editor either approves the article and passes it to the designer or sends it back to the writer with instructions on what to fix
- The editor, as per writer instructions, creates the appropriate visual assets. Sends it over to the marketer for setup
- The marketer uploads the article on WordPress or CMS, optimizes it for search, shares it with influencers, etc.
Want to start using workflows for your content management, but not sure where to start? Read up our guide on content marketing workflows
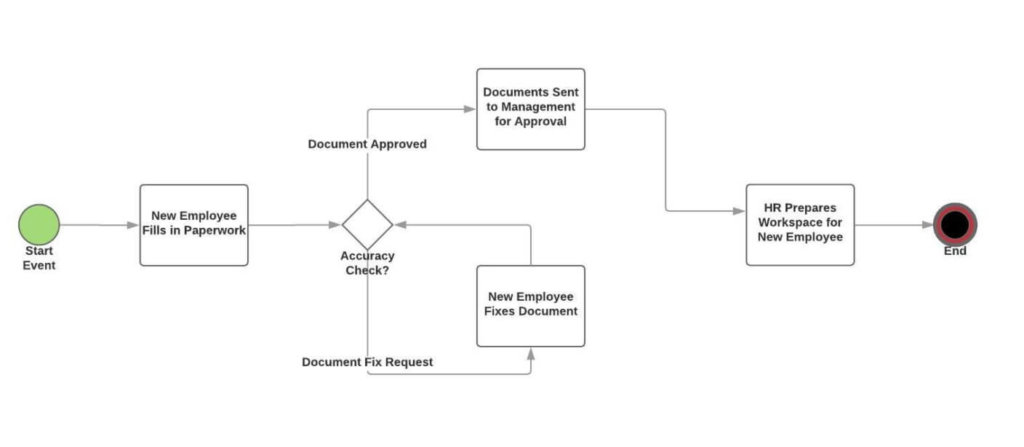
Employee Onboarding - It is essential that your new employee starts work on the right foot. Structuring and optimizing the process makes this significantly easier.
- The HR sends out all the paperwork to the employee
- The employee sends back the filled-in documents
- The HR passes them along to company management for signature and approval
- Office manager ensures that the workspace and company software are both ready for the new employee
- Once the new hire shows up, “employee orientation” starts
Ready-to-use workflow templates
How to create a workflow diagram
Symbols and tools
Before you can create a workflow diagram, you should have a basic understanding of how the symbols work. The symbols, however, vary.
There are a lot of ways to document workflows, some of which can be hard to learn and remember (BPMN, for example). Here is a simple cheat sheet to help get started, though… 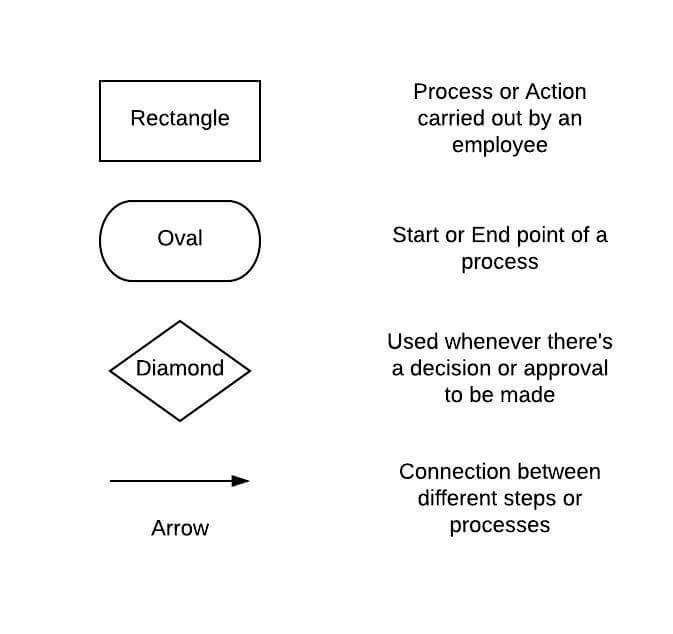 While the list we have mentioned above is not comprehensive (there is a lot of different symbols depending on use-case), it is a simple way to get started.
Then, once you have got the symbols down, you will need to pick the right tool. Pen and Paper - the most basic (and easiest) option.
Just grab a pen and paper and draw the process either from memory or through consulting the process lead. Flowchart Software - software dedicated to graphing, specifically. Since you will probably be storing the charts online, anyway, this takes out the extra step of scanning.
Workflow Management Software - just about the same thing as flowchart software, with several significant benefits. Software, in addition to visualization, lets you keep track of the workflow online, automate certain steps, identify bottlenecks through analytics, etc.
5 steps to creating a workflow diagram
Now that you know how the technicalities work, here is how to create the diagram that is going to be both legible and helpful. It’s simpler than it looks.
Step #1: Pick the process to graph
First off, you will need to determine what is the purpose of the diagram. i.e, is it for onboarding?
process analysis and improvement? Depending on what you are going for, you would need to include different types of information. For analysis, for example, you would have to be a lot more specific about process steps, mentioning information such as resource input, output, etc.
With onboarding, you just have to mention the roles, responsibilities and exact to-dos. You should also consider who is going to be seeing the workflow.
If it is a client, you should not mention any overly sensitive company information. Finally, make sure to strictly define the workflow - where does it start, and where does it end. This ensures that you do not go overboard and map the exact process you want to work with.
Step #2: Gather information
Whatever your role is in the organization, chances are, you do not know everything there is to know about every process. Consult the right people and learn as much as you can. Ask questions, such as…
-
Who is in charge of what activity or task?
-
What is the process timeline? 3.
Are there possible deviations? 4.
What tasks are involved in each step of the process? 5. Are there any delays in the process?
Potential improvements? Bottlenecks?
Step #3: Design the workflow
Now that you have a good idea of how the process works, you can finally design the process. Use the information you have learned to finally visualize the as-is process.
If you are using the workflow diagram for onboarding or process instruction, you are done. All you have to do is ensure that all the right employees have access to the graph. If, instead, you are in it for process analysis or improvement, move to the next step.
Step #4: Analysis and improvements
Now that you have already done the visualized the process, you probably already know a thing or two you could improve the process - or at least, from what I’ve seen, most people do. If now, you can ask yourself several questions…
- Are there any process steps that are lagging? Bottlenecks? Tasks taking more time than they should?
- What are the most important activities for the process to be successful? How do they affect the end-product? Can you make them more efficient through automation? Cutting out steps? Changing things up?
- Are certain steps riskier than they reasonably should be? Any missed deadlines?
- Can you identify processes that are more expensive than they should reasonably be?
To make this step easier, you can use several different analysis techniques, such as the Cause and Effect Analysis or the 5 Whys Method
Step #5: Create a to-be process
Once you have got the improvements figured out, you want to reflect that on your workflow diagram. While you could just start executing it, it is more efficient to have something to show to your employees. This way, they are far more likely to stick to the new method, rather than revert back to the old one whenever you are not looking. Or, if you are using workflow management software, all you have to do is make a change to the process template, which will ensure that whenever the employees start a process, it is going to be the latest version.
Types of workflow diagrams
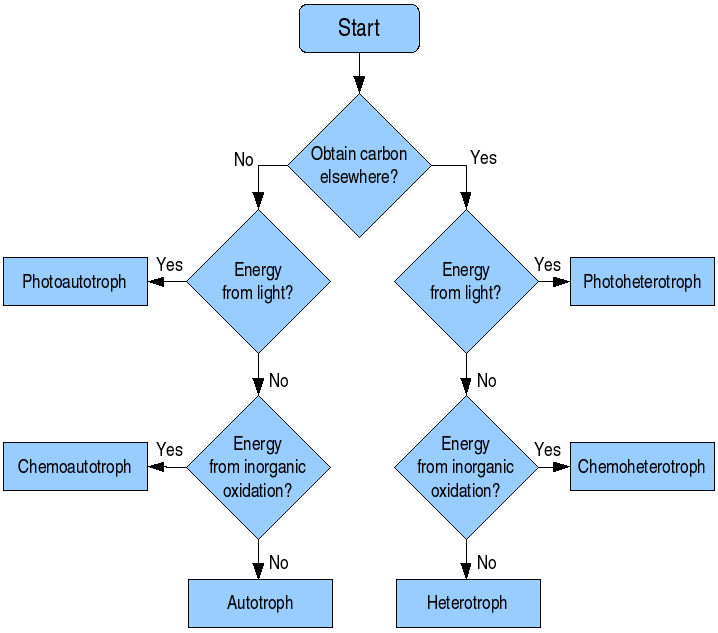
There are several different ways to create workflow diagrams, with these 4 being the most popular. Process Flowchart - the simplest (and the most straightforward) type - all you have to do is map the process chronologically (what follows what).
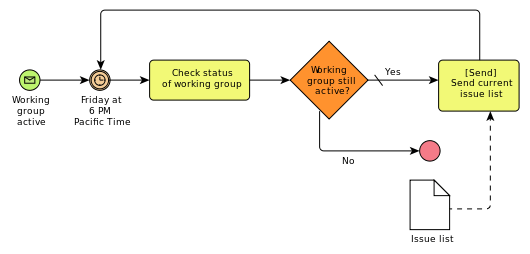
 BPMN - a very specific way of creating flowchart diagrams. The difference is that BPMN uses standardized symbols and elements, making it easier for other people or companies to understand the diagram.
  Swimlane - functions just about the same as a regular flowchart.
The one differentiator here is that the process is split into different departments. 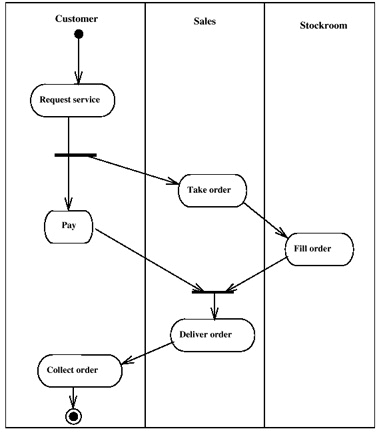 SIPOC - stands for Suppliers Inputs Processes Outputs Customers.
Unlike the flowchart, SIPOC does not have anything to do with the order of steps within a process. Rather, it focuses on analyzing the most important aspects of a workflow. 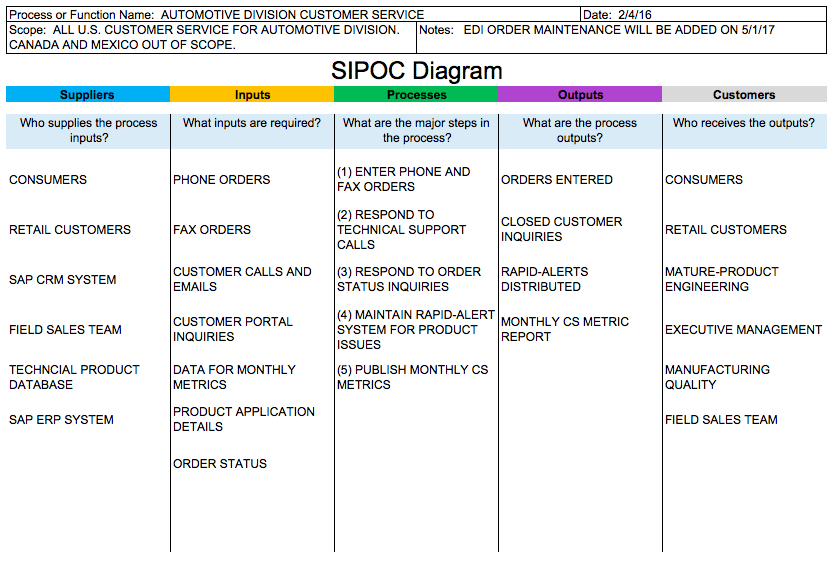
Automating workflows with software
While having workflows documented is beneficial, automating them is even better. Workflow management software helps route tasks between different employees, cutting out the need for the chaos of emails.
On the employee-end, you get a dashboard of tasks and to-dos. As a manager, on the other hand, you have a top-down view of all your workflows, as well as deadlines, bottlenecks, etc. And the best part?
It is free for up to 5 users. Give Tallyfy a try and see how the software increases efficiency first-hand.
Not sure about how to use workflow software? We have got you covered with our complete guide! If, on the other hand, you are stuck between choosing different providers, read up on how to pick the right workflow management system.
Related questions
What are the 3 types of process flow diagrams?
The three main types of process flow are: basic flowcharts, (simple shapes with arrows pointing from one shape to another); swimlane diagrams, (which reveals who does what, when); and value stream maps, (which is all about time and how much time you are wasting). Simple processes work best with a basic flowchart, while swimlane diagrams help you go beyond a simple process and explore speed and efficiency through division of labor and resources - everything else may fit best with a value stream map.
What is the difference between a flowchart and a workflow?
A flowchart is akin to a map that lays out the steps in any process using a set of shapes and connecting lines, but a workflow represents the actual process sequence that people follow to accomplish their work. Pretend the flowchart is the blueprint, and the workflow the building. Flowcharts can describe all sorts of processes, but workflows zero in on how work moves between people and teams.
How to make a workflow diagram in Word?
It is actually quite easy to draw a workflow diagram in Word. Begin by clicking on Insert > Shapes > New Drawing Canvas.
Then Categories, Shapes and add boxes, arrows and connectors. Word comes with its own SmartArt graphics dedicated to the area of workflows - just look in Insert > SmartArt > Process. You can tweak the colors, add text, move the shapes around - all until your workflow looks perfect.
How to create a workflow diagram in Excel?
Excel supports basic workflows using its Shapes feature. Insert > Shapes and pick your shapes.
Connect steps with connectors, and right-click on shapes to add text. You should instead take advantage of Excel’s SmartArt (Insert > SmartArt > Process) to have more control. Pro tip: Zoom out of your spreadsheet view to provide more space in which to create your diagram.
What symbols are commonly used in workflow diagrams?
Workflow charts contain recognizable symbols that anyone can apprehend. Rectangles depict tasks or operations, diamonds indicate decisions, arrows depict flow direction, and ovals mark the beginning and end of process. Circles are often used to show relationships among parts and cylinders to depict data or documents.
How detailed should a workflow diagram be?
A flowchart must be simple enough to follow, while not too elaborate as to provide a complete process guide. Try to get down to between 5-15 main steps for most of your processes. If you require fine detail, split your drawing into subprocess or draw a more detailed diagram for complex steps.
Can workflow diagrams help improve efficiency?
Workflow charts are great for identifying inefficiencies. Visual maps of your process can help you spot bottlenecks, extra steps, duplicate actions and more. Teams frequently find that there are steps which can be automated, or completely dispensed with once they have seen the entire workflow written down on a wall.
What is the best software for creating workflow diagrams?
Although you can get by with simple tools like Word and Excel for basic diagrams, their bottom-line is that dedicated software (Lucidchart, Draw.io or Visio and provides more features and flexibility. You should use online tools most of all because they enable to work together in real time and it is really convenient to share them. Select software according to your requirements regarding collaboration, complexity, and how it integrates with other tools.
How often should workflow diagrams be updated?
Your workflow diagrams should be alive - living artifacts that grow alongside your process. Revisit and reevaluate when you have made major process change, at least every six months. Frequent review makes sure the diagram remains relevant and useful, particularly as the team grows and technologies evolve.
What is the difference between linear and parallel workflows?
In linear workflow we go successively from a start to end point and each step follows the other when it finished. Parallel workflows enable a number of different things to be occurring at the same time, thereby saving time though needing more precision. Your diagram should make it obvious whether steps can be done in parallel or one of them must proceed the other.
About the Author
Amit is the CEO of Tallyfy. He is a workflow expert and specializes in process automation and the next generation of business process management in the post-flowchart age. He has decades of consulting experience in task and workflow automation, continuous improvement (all the flavors) and AI-driven workflows for small and large companies. Amit did a Computer Science degree at the University of Bath and moved from the UK to St. Louis, MO in 2014. He loves watching American robins and their nesting behaviors!
Follow Amit on his website, LinkedIn, Facebook, Reddit, X (Twitter) or YouTube.

Automate your workflows with Tallyfy
Stop chasing status updates. Track and automate your processes in one place.