Value stream mapping is a visual tool that shows you exactly where waste lives in your end-to-end processes. It traces every step, from the moment raw materials arrive to the second a finished product ships out, and forces you to confront what’s actually happening versus what you think is happening.
Summary
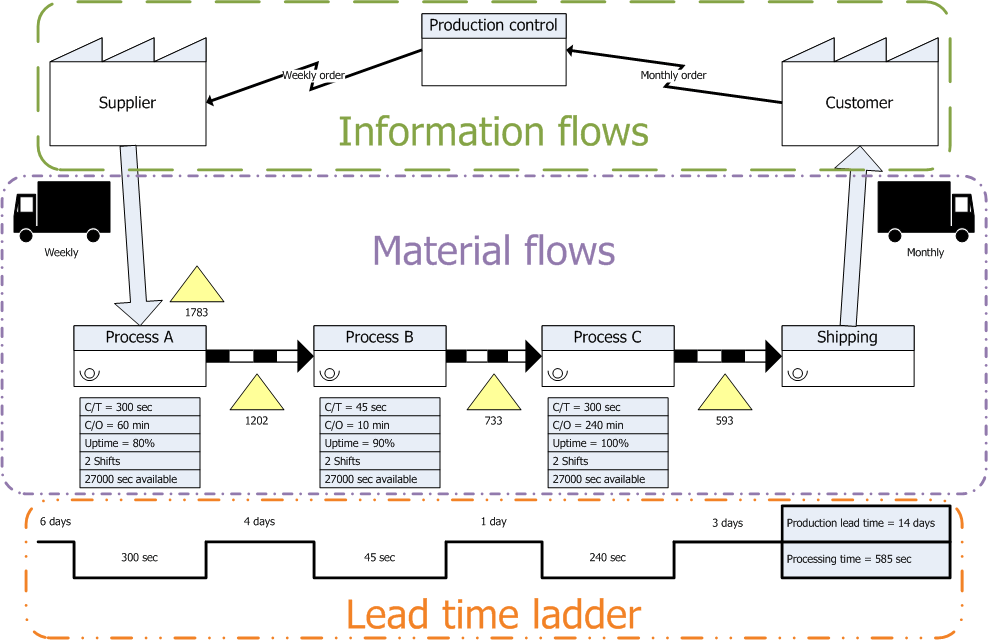
- VSM maps your entire production flow - Every step from supplier delivery to final shipment gets documented, including value-adding work (sowing, growing, grading) and non-value-adding steps (transport, waiting), plus all information flows between departments
- Spots three profit-killing problems - Delays that stall production, constraints that limit throughput, and excess inventory tying up cash. Originally built for manufacturing, but it works in any industry where work flows through multiple hands
- Follow a 7-step approach - Define start and end points, map all process steps, trace information flows, gather cycle time and inventory data, add timelines showing lead time versus actual work time, identify the seven wastes, then build your ideal future state map
- Seven wastes eat your margins - Transport, Inventory, Motion, Waiting, Over-processing, Overproduction, and Defects. Each one is money walking out the door. See how Tallyfy helps eliminate process waste
Value stream mapping is a lean management tool, pioneered at Toyota, that helps you see every step between product creation and final delivery. Like other business process mapping methods, it’s great for introspection, really understanding how your business works, and for spotting where things break down.
Here’s the part that most people miss, though. So if your value stream is full of hidden waste, automating it just means you’ll produce waste faster. That’s why mapping comes first.
Source: wikipedia
The inputs for a value stream map include all the resources you use to produce goods or services. Your route follows value-adding steps alongside their attendant non-value-adding steps. And the map also tracks information flows: who tells whom what, and when.
How to use a value stream map
A value stream map gives you a bird’s-eye view of your business processes. From there, you can analyze each workflow, hunting for waste and inefficiencies. What should you look for? Three things jump out most often:
Tallyfy is Process Improvement Made Easy
- Delays that hold up the process
- Constraints that limit throughput
- Excess inventory tying up resources that could be earning money elsewhere
While value stream mapping grew up in manufacturing, the same principles apply to service businesses, healthcare, software delivery. Basically anywhere work moves through multiple stages and handoffs.
Getting started with your first map
First, decide what you’re mapping. Some businesses can cover everything in one value stream map. That works if you produce a single product.
Got a complex mix of products or services? You’ll need separate maps for each. Which one to start with is your call, but generally you’d want to tackle the highest-value areas first.
To actually do the mapping, pull together a small project team with representatives from different departments. We kept hearing the same thing when walking new teams through their first maps, and this proper cross-functional approach reveals bottlenecks that no single department could identify alone. One operations manager told us their VSM exercise uncovered a 3-day wait time between quality inspection and shipping that nobody had spotted because it fell between two departments.
You might even find several improvements before you finish the map. Funny how that works.
Next, you need a facilitator. This could be a senior manager who understands value stream mapping, or you can bring in an external consultant.
Be ready to redraw as you go. Someone will remember a missed step, and that can change the whole picture. To draw the map itself, you’ve got options:
- Pen and paper - grab an A3 sheet and a pencil. Simple works.
- Flowchart software - dedicated tools for all sorts of process mapping
- Workflow management software - Tallyfy and similar tools let you map and then actually manage the workflows you’ve documented
Value stream mapping symbols
Symbols make your visual overview readable at a glance. They show exactly what kind of step you’re dealing with. Do you need to memorize every symbol? No. You could invent your own symbols, but it’s easier to find an established style and stick with it.
Most symbols are intuitive. A pair of spectacles means someone has to “go and see.” A truck means transport. You get the idea. Don’t overthink this part - the symbols aren’t where teams get stuck. It’s what they do with the completed map that matters.

Seven steps to build your value stream map
Now that you know the basics, here’s how to actually do it.
Decide your scope
Start by setting a beginning and end point. This shows where your internal process starts and stops. Some companies prefer to map the entire value chain, but that has trade-offs. You get a bigger picture, yet there’s usually not much you can do about external processes outside your control.
Most value stream maps begin with supplier delivery of materials and end with delivery to the buyer. Place your chosen start and end icons on the left and right sides of your map.
If your production processes are complex or messy, you might map each value-adding process in greater detail after completing the overall picture. In that case, use the process that allocates work as the “supplier” and the process that receives it as the “receiver.”
Map every step
Determine what processes sit between point A and point B.
Simple example: a nursery producing ornamental plants begins with seed from a supplier and delivers plants to a buyer. Value-adding steps along the way might include:
- Sowing
- Transplanting
- Growing
- Grading
- Shipping
Trace the information flows
One of value stream mapping’s real strengths is that it captures information flows, not just material flows. Our plant nursery needs to place orders with suppliers, and buyers place orders for delivery. How often does that happen? Through what channel? Record it.
The teams responsible for each process also need information. Where does it come from? How does it travel? Maybe our flower grower has a centralized planning department that receives sales information and places seed orders. That department then pushes a weekly or monthly schedule to each production team.
Add this department between your input and output blocks, draw a schedule block below it, and connect arrows from the plan to each department it informs.
Gather critical data
You’ve got the skeleton. Now it’s time for real numbers. Some of your mapping team might need to spend time collecting data on the ground. Typical data points include:
- Inventory items held for each process
- Cycle time (typically per unit)
- Transfer time between steps
- Number of people needed at each step
- Scrap rate
- Pack or pallet size
- Batch size each step handles
Add timelines to the map
Once you have the data, start filling it in. This is the most tedious part. I won’t pretend otherwise. Draw a data box under each process block.
If you’ve used historical data, verify it against current inputs and outputs. Things drift.
Add timelines beneath your data blocks. These show the lead time needed to produce products and the actual time spent producing each unit or batch. Don’t be surprised if a product with weeks of lead time takes just a few hours of actual work. That gap? That’s where your waste lives.
Identify the seven wastes
Just creating a value stream map without using it would be a total waste of time. Ironic, right? Here’s where you hunt for the seven wastes of lean, catalogued by Taiichi Ohno, that eat your margins:
- Transport doesn’t add value to your final product, unless you’re in the transport business. Look for ways to reduce unnecessary movement of materials or information.
- Inventory of inputs and finished products ties up cash that could be working elsewhere. Keep inventory as low as possible without stalling production. Easier said than done, obviously.
- Motion costs time. Our nursery worker moves her transplanted seedling 10 feet from the potting table to the tractor wagon. That’s wasted movement, wasted seconds, hundreds of times a day.
- Waiting because of a bottleneck upstream is a clear waste of resources. We’ve observed that this is often the biggest hidden cost. People standing around because a previous step isn’t done.
- Over-processing can be hard to spot, but if an item can move to the next step in acceptable condition with less input, it should.
- Overproduction is a sneaky trap. Even if your product isn’t perishable, storing and monitoring it until someone buys it is pure cost.
- Defects mean rework or scrapping. Both are money-eaters. How can you reduce defects at each step?
Build your ideal future state
You know how things look today. How do you want them to look? Work with your team to map an ideal value stream that eliminates, or at least shrinks, every waste you spotted.
You probably won’t get there in one leap. Create a series of intermediate future state maps. In our experience helping teams implement lean improvements, the organizations that set specific milestone dates for each intermediate state are the ones that actually reach their ideal. The rest just talk about it.
What should you do after reaching your ideal? Start mapping again. Turns out, few processes are so perfect there’s nothing left to improve. Your goal is nothing less than operational excellence.
This is also where tools like Tallyfy become useful. Instead of mapping on paper and hoping people follow the new process, you can encode the improved workflow into software that tracks and enforces it. No more “we used to do it this way” drift.
Do you see the waste?
What busywork costs your company
per week
per year
over 5 years
Making value stream mapping stick
Does value stream mapping last without follow-up? Rarely. The biggest drawback of value stream mapping done the old-fashioned way is time. The gaps between report-backs and meetings let momentum die. For teams wanting to slim down process flows quickly, that lag is brutal. There’s also the monitoring problem - you’ve decided on changes, great, but unforeseen consequences can ripple out from new parameters. People might get it wrong because they’re not used to the new method yet. Running Tallyfy taught us that the real risk isn’t making the wrong change - it’s losing the thread between mapping sessions and letting the old habits creep back in. The fix is adopting technology that closes those gaps. Tallyfy works as a workflow management tool for process mapping and data gathering, and it enforces your new processes so they don’t quietly revert to the old way. Why not try the free demonstration?
One thing that’s become clear over the past few years: process improvement isn’t optional anymore. With AI entering every industry, the companies that mapped and standardized their processes first are the ones getting real value from automation. That is an oversimplification, but not by much. Everyone else is just scaling their mess.
