Summary
- Business process mapping makes invisible work visible - It shows you where handoffs break down, where tasks pile up, and where people invent workarounds nobody documented; it’s the foundation for continuous improvement (BPM), fixing inefficiencies (BPI), and full redesigns (BPR)
- Mapping dates back to 1921 and it still matters - Frank and Lillian Gilbreth introduced flow process charts with one key insight: you must see the entire process at once before changing any part of it. Procter and Gamble was among the first to adopt this, and it became an industrial engineering standard
- Different map types solve different problems - High-level maps show core flows between departments, low-level maps detail specific tasks, and cross-functional swim lane maps expose where handoffs fail; pick from flowcharts, swimlane diagrams, value stream maps, SIPOC diagrams, or BPM software
- AI does not fix bad processes - it scales them - If your workflows are broken, throwing automation or AI agents at them just makes the chaos faster. Mapping is the prerequisite. See how Tallyfy maps processes
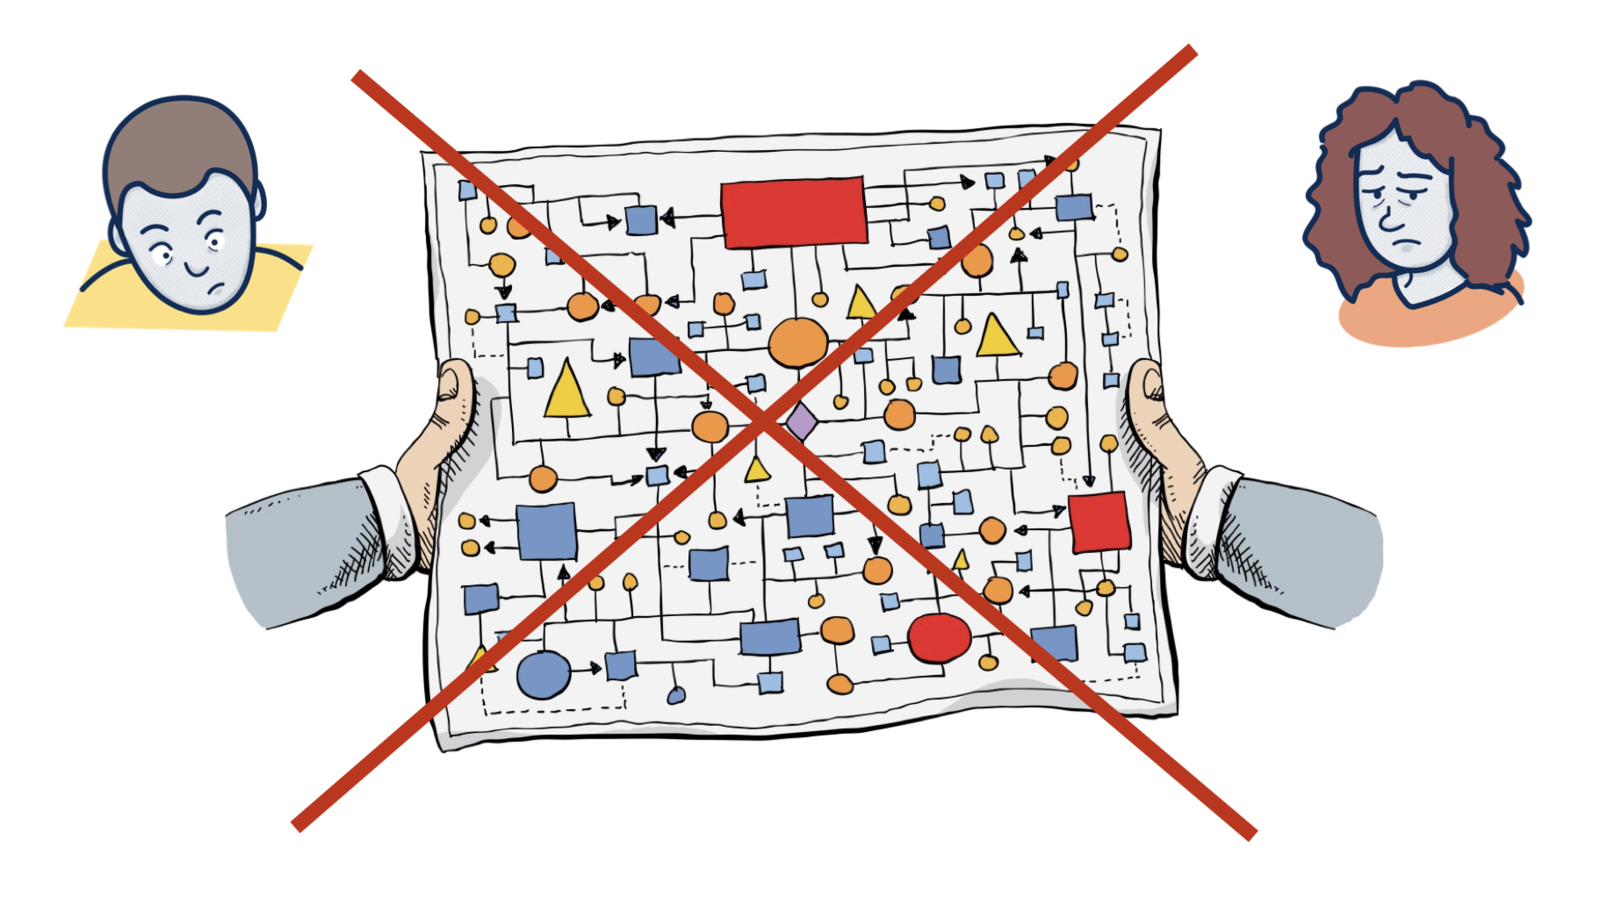
Business process mapping is the act of visualizing how work actually moves through your organization. Not how you think it moves. Not how the org chart says it should move. How it really happens, with all the broken handoffs, bottlenecks, and workarounds that nobody talks about.
If you’ve ever wondered why a report takes three weeks when it should take three days, mapping will show you.
Try the free SOP generator
By Tallyfy. Get a Word doc in ~15-20 seconds. No sign-up.
Tap a section to preview the steps, or download the full Word document below.
This is where it gets interesting: in our experience, only about 10-15% of the time a piece of work spends in a process actually adds value. The rest? Waiting in queues, sitting in inboxes, getting approvals nobody reads, bouncing between systems. That gap between perception and reality is exactly why process mapping exists.

Business process mapping gives you a top-down view of how your business works. On its own, the main benefit is the introspection - you see things you’d otherwise miss.
But it’s also essential for:
- Business Process Management (BPM) - A method of constantly re-assessing your process efficiency. Impossible without having processes mapped out first
- Business Process Improvement (BPI) - Focused on identifying wasteful or broken processes and fixing them
- Business Process Re-Engineering (BPR) - Using new technology or methods to rebuild processes from scratch
Process mapping is a one-time activity. Running processes is the everyday job.
A brief history of process mapping
Process mapping dates back to the early flow process chart by Frank and Lillian Gilbreth, which they unveiled in 1921 as part of a talk called Process Charts: First Steps in Finding the One Best Way.
They introduced it by saying:
Every detail of a process is more or less affected by every other detail; therefore the entire process must be presented in such form that it can be visualized all at once before any changes are made in any of its subdivisions.
That quote is over a hundred years old. It’s still spot on.
The flow process chart uses graphics and symbols to represent the flow of activities within a process. After the Gilbreths’ talk to the American Society Of Mechanical Engineers, it became standard practice across much of industrial engineering in America. ASME officially introduced a range of symbols in the Standard for Process Charts in 1947.
One of the first businesses to adopt it was Procter and Gamble, thanks to Art Spinanger. He’d learned about it from industrial engineer Allan H. Morgensen, who had in turn based his efficiency lectures on the original Gilbreth concept.
High-level vs low-level process maps
In any business, there are workflows and workflows within workflows. A high-level process map names the core processes, the inputs, and the outputs - showing how they relate to suppliers and the people you serve. You can use different colors to indicate flow types: red for primary material flows, black for inventory, dotted lines for information.
Once you have the high-level map, zeroing in on the details becomes much easier. Simple example: your high-level map shows flow lines going from sales to accounts and from accounts to the buyer. But what’s the accounts department actually doing? When you look closer, you see they’re setting up accounts, issuing invoices, receipts, credit notes. They’re probably chasing overdue payments and sending monthly statements too. Each of those tasks is its own process - and each deserves its own low-level flow.
Then there’s the question of how departments work together on a single sub-process. That’s where cross-functional “swim lane” maps come in. You create horizontal levels showing which function performs each task and how work flows from one to the next. We’ve seen manufacturing and service companies map processes with 20+ steps flowing through service teams, estimating, operations, material control, and installation - and the cross-functional view instantly reveals where handoffs break down.
Why does this matter more now than ever? Because everyone’s building AI agents, but nobody is building the workflows they need to follow. Turns out, without mapped processes, AI agents have nothing structured to operate on. They’re just chatbots.
Types of business process maps
There are several types you can use. Each has tradeoffs. Is there one type that covers everything? No.
Process Flowcharts - The most common type, closely resembling what the Gilbreths introduced almost a century ago. They can be hand-drawn or created in software like Office. The downside is limited flexibility. But simplicity and familiarity have their own appeal, so flowcharts won’t vanish anytime soon.
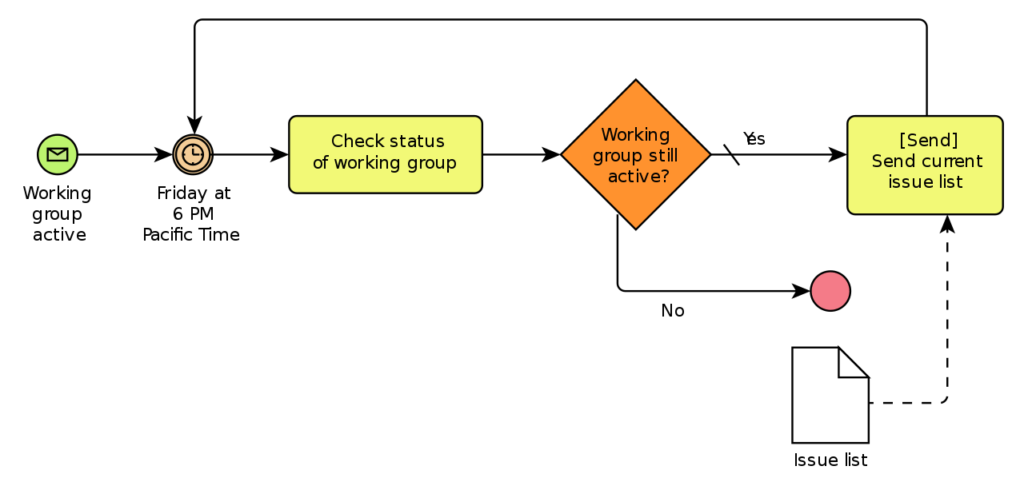
Source: wikimedia
Want to learn more? Check out our guide on process flowcharts.
Swimlane Diagram - Functions almost identically to a generic flowchart, with one key difference: each step is divided between different teams or individuals who are responsible for them. This makes it a very clear system when you need to see who owns what.
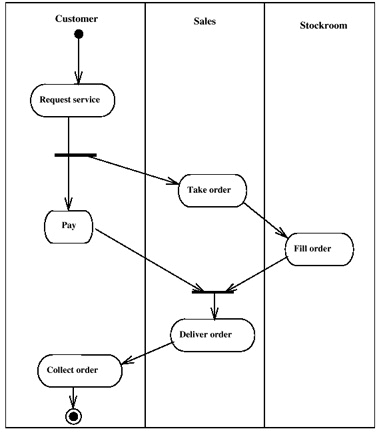
Source: flickr
Value stream map - Often used in lean six sigma applications. They’re less straightforward to analyze at a glance, which makes them potentially more useful for deep analysis but also less commonly used.

Source: wikimedia
Want to learn more? Read our article on the ins and outs of value stream mapping.
SIPOC - Stands for Supplier Inputs Processes Outputs Customer. It’s a very simplified process map that strips away 99% of the information to focus on the essentials of the process and the people involved.
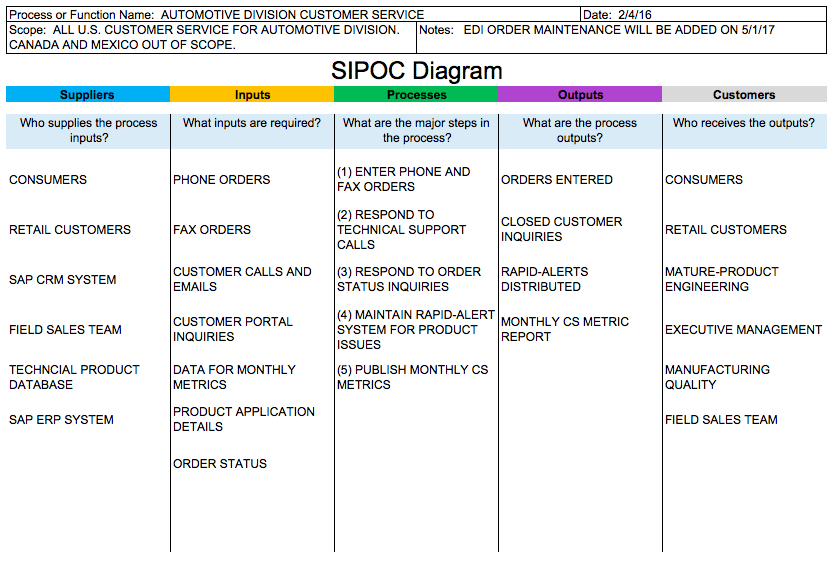
Source: sipoc.info
Want to learn more? Read our guide on SIPOC diagrams.
Software - The most high-tech option for process mapping is Business Process Management Software. The added benefit is that software also lets you track processes after mapping: how they’re performing, where bottlenecks are, which deadlines get missed.
It can also be used by your team to track tasks and to-dos. This makes process improvement much easier since you can see when and where anything goes wrong.
Want to learn more about process management software? Check out our guide to some of the best BPM tools out there.
To be fair, software alone won’t fix anything. If you want to move beyond static diagrams and create living process documentation that teams actually follow, process documentation software can turn your mapping efforts into trackable, improvable workflows.
Tallyfy is the only product available that does Process Documentation and Process Tracking in one
Why mapping is worth the effort
Look, I think most teams are leaving money on the table because they haven’t mapped their processes. Here’s what you get when you do:
You see who owns what. Every once in a while, you end up in a situation where nobody knows what is going on with a certain process. Who’s in charge? Why is the report not ready? A business process map makes responsibilities visible - it’s going to be clear who does what at each step.
You find root causes, not just symptoms. Spotting the problem is easy - just look at what blew up. Finding the source? That’s harder. A map visualizes the entire chain of events that led to the bottleneck. At Tallyfy, we’ve seen teams spend weeks chasing symptoms before realizing the root cause was three steps upstream in a handoff nobody documented.
You catch risks before they catch you. Mapping is a great tool for spotting potential risks from processes that leave the company open to legal or health and safety problems. If you miss a step that is critical to government regulations, it can be extremely hazardous. Think fines, lawsuits, the works. I think this is probably the most overlooked benefit of mapping. One mid-sized services company told us they discovered staff were “performing outdated or irrelevant tasks without knowing” - their process mapping initiative revealed so much redundancy that they eliminated 50 positions while actually improving quality and quadrupling revenue.
For the same reasons, process mapping can supply evidence for regulatory standards in terms of compliance.
You establish best practice. Once a process has been mapped and improved, the map becomes evidence of best practice and a benchmark for other processes across the organization.
You show the big picture. In any business larger than a handful of staff, silo mentality develops over time. People lose sight of what the business is trying to achieve. Process mapping helps everyone understand the big picture and get re-engaged with the vision. This, in turn, makes it easier to hit the bigger goals.
Steps to successful process mapping
Want to give it a try? Here’s how.
Pick the right process first. You probably want to start with a process that’s critical to your business, where improvement can easily be tracked with numbers. There are three ways to select:
- Reactive - A process has failed or is majorly underperforming because of a bottleneck. You map to identify and fix the issue.
- Strategic - Mapping is part of a high-level overhaul, so you pick a process integral to the organization’s goals.
- Focused on the people you serve - You select a process because improving it will deliver a visible boost for the people relying on your work.
Bring in the right people. Even if you know your business inside out, you’ll still want to work with the people who deal with the process daily. Their input can be priceless - they might already have ideas for improvement. A digital strategy consulting firm’s COO told us: “By forcing ourselves to write out the processes we can now ensure that steps are not missed or done out of order. Generally, there are fewer mistakes.” Frontline teams often spot inefficiencies that management never sees.
You might also want someone from senior management on the team. Without one, you might need approval on even the smallest change.
Want to get buy-in for company change? You can use change management models such as the ADKAR model or Bridges Transition Model.
Gather information. All steps need to be identified and recorded - which job title does which step, when, and how. At this stage, it’s better to collect too much information and filter it down, rather than end up short and have to revisit the process.
Here’s something that often surprises people: one of the best techniques is what some call “process stapling” - you literally follow a single piece of work through the entire process, almost stapling yourself to the paperwork. Walk the floor. Sit with the people doing the work. Watch where things pile up, where handoffs get messy, where people cobble together workarounds nobody documented. The gap between how managers think work flows and how it actually flows can be startling. Conference room process maps almost always look cleaner than reality.
Interview key figures. Talk to the people involved to find out their understanding of the process. Use what you get back to identify problems and opportunities. Staff will bring their own feelings and agendas into their descriptions - but it’s still important to listen.
Produce the baseline map. With all your data, draw up the baseline map. This shows how the process currently operates, flaws and all. It acts as evidence for what needs to change and as a comparison after improvements are made.
Using process mapping software is the easiest, most consistent, and most scalable way to do this. If you’re not using software, here are the basic components:
- Process - The overall workflow
- Tasks - Each step, usually something actioned by a person or system
- Flows - Connecting lines and arrows showing how work moves from task to task
- Events - Triggers or gateways that begin, redirect, or end a process
- Participants - The people or systems involved
Analyze and improve. What’s the point of the map unless you learn something from it? From your investigations, you’ve probably already spotted a flow or two that needs fixing. With the full map, you can find more. Carry out BPI or Michael Hammer’s BPR, find different ways to improve (or maybe restructure from scratch). Test new approaches on a smaller scale first. If they work, apply them broadly. If people struggle to adapt, create and share a new process map.
After watching hundreds of teams try this, the biggest pitfall is analysis paralysis. Teams spend weeks perfecting the map instead of acting on what the first draft already tells them. The first version of any process map reveals enough problems to keep an improvement team busy for months. Don’t wait for perfection before you start fixing things.
Not sure how to find improvements? Learn about the 4 most common ways to improve processes.
Monitor what you changed. Whether you’re doing this as part of a larger overhaul or not, you need proper monitoring. Only through constant monitoring and iteration can you expect processes to keep getting better. Based on hundreds of implementations, this is where Tallyfy really shines - turning static maps into living workflows that update as processes evolve.
Process mapping can’t be a one-time thing that fixes everything. It’s ongoing. That discipline separates successful implementations from failed ones.
Keeping your maps current
Process maps capture how work gets done - but processes are not static. Every now and then, you’ll implement a tweak. If you don’t capture it, your maps will soon be outdated and worse than useless. In our experience, this discipline is one of the top three topics in conversations we have about process documentation.
One principle worth remembering when designing a map: keep it uncluttered and easy to follow. Use different shapes of text boxes to indicate activity types. Place core steps in vertical rectangles, decisions in diamonds, data transfer in horizontal rectangles. These shapes are standardized in Unified Modelling Language, but there’s nothing stopping you from choosing other shapes if they work better for your team.
Process mapping templates to get you started
Related questions
What are the four steps of process mapping?
The four main steps are: defining the scope of the process to be mapped, collecting information from the people who carry out the work, drawing the process map with simple geometric elements, and analyzing the map to identify where things can improve. Think of it as: decide where to look, ask the people who do the work, draw what you find, and then fix what’s broken.
What are the six main methods to create business process maps?
There are six main diagram types: flowcharts (boxes and arrows), swimlane diagrams (showing who does what), value stream maps (where waste and value are identified), SIPOC diagrams (describing who supplies to whom), detailed process maps (a step-by-step breakdown), and cross-functional flowcharts (showing how departments work together). Each captures a different angle of the same process.
How do you write a business process map?
Start by watching the process in action and talking to the people who do it daily. List out each step in order. Use basic shapes - circles for start and end, rectangles for actions, diamonds for decisions - connect them with arrows, and include clear labels. If your map looks like a plate of spaghetti, you’re overcomplicating it.
What are the various kinds of process mapping techniques?
Beyond the simple flowchart, you’ve got hierarchical process maps (showing different levels of detail), spaghetti diagrams (tracking physical movement), BPMN (Business Process Model and Notation, a standardized approach), and mind maps (useful for brainstorming). Different problems call for different tools.
What tool should you use for business process mapping?
Modern process mapping is typically done in digital tools like Tallyfy, which lets teams map, share, and iterate on processes in real time. Tools as simple as Microsoft Visio or even pen and paper can work, but with specialized workflow software you can turn static maps into living processes that teams actually follow and improve.
What is the difference between process mapping and process modeling?
Process mapping is a snapshot of how work happens today - it describes the current state. Process modeling is more like architectural planning - it guides how work should happen in the future. Mapping describes reality. Modeling helps you test changes before you make them.
Why is process mapping needed?
It makes invisible work visible inside organizations. That’s the key. It exposes bottlenecks, duplicate steps, and areas for improvement. It’s like X-ray vision for your business - you can see what’s broken, bring new people up to speed faster, and make sure everyone understands how things should be done.
How often should you update process maps?
They should be living documents, updated whenever major changes happen or at least reviewed quarterly. Just like GPS needs updated maps, your process maps need refreshing whenever you find better ways of working, adopt new tools, or discover rules your team didn’t know about.
What makes a process map effective?
An effective process map is clear enough for a newcomer to understand, detailed enough to be useful, but simple enough to read at a glance. It should use standard symbols, include all major decision points, and show step by step how work flows from start to finish. Think of it like a good recipe - enough detail to get the job done, but not so much that it’s unreadable.
How do you identify processes worth mapping?
Focus on processes that affect the people you serve, consume heavy resources, or have recurring problems. Look for processes that cross department lines or ones that teams frequently argue over. These are the main roads of your business - the most important paths to map first.
What common mistakes should you avoid in process mapping?
The big ones: making maps too complex, failing to include exceptions and error handling, not bringing in the right people, and creating maps that just sit in a drawer collecting dust. The most effective process maps are living tools that teams actually use. Not perfect diagrams that nobody looks at.
How do you get team buy-in for process mapping?
Involve the team from the start, explain how mapping is going to make their work easier, and use their input when creating the maps. Deliver early wins by solving easy problems the mapping highlights. If everyone helps build it, everyone sees the value.
