We spent three weeks testing 14 process mapping tools, from free diagramming apps to enterprise automation platforms. What caught us off guard was how wide the quality gap is between tools that look similar on paper.
Summary
- 14 tools tested across four categories - Free diagramming (Draw.io, Canva), professional mapping (Lucidchart, Creately, SmartDraw, EdrawMax, Visio), workflow platforms (Miro, ClickUp, Notion, Pipefy), and legacy BPM (Camunda, ProcessMaker, Tallyfy)
- Draw.io remains the best free option - Zero cost, no trial expiry, solid Confluence and Google Drive integration. But sharing requires workarounds and there’s no built-in process execution
- Lucidchart dominates collaborative diagramming - BPMN, SIPOC, and Value Stream templates with real-time co-editing. A 2024 Verified Market Research report values the process mapping software market at over $1.2 billion
- The real gap is between mapping and doing - Drawing a process is step one. Running it with tracked tasks, deadlines, and accountability is where most teams stall. See how Tallyfy bridges that gap
Tallyfy is the only product available that does Process Documentation and Process Tracking in one
Why most process maps die within a week
Someone spends hours making a beautiful flowchart. They share it around. People nod. Then the diagram sits untouched in a shared drive while the actual process runs on muscle memory and Slack threads.
That’s the dirty secret of process mapping.
The map itself is never the hard part. Keeping it alive is. A PMI survey found that organizations waste roughly 11.4% of investment due to poor project performance, and broken processes are a root cause. If your team draws a process once and never opens it again, you’ve just added to that waste pile.
Something we learned the hard way at Tallyfy: teams don’t need better diagrams. They need diagrams that turn into real, trackable work. But you still need to start somewhere, and picking the right tool matters more than most people think.

How we evaluated these tools
Most process-mapping listicles benchmark against marketing pages and feature checklists. We benchmarked against switching reality. Across nearly 45,000 leads in our CRM, Visio shows up in note text 197 times. Lucidchart 11. Miro 17. ClickUp 22. Visio’s enterprise install base creates a switching pipeline that no review-site listicle picks up because the data isn’t public. We tested each tool by building the same three-step onboarding workflow, then we scored five things:
- Time to first diagram - How fast can someone with no training produce a usable process map?
- Collaboration - Can multiple people edit simultaneously? How does sharing work?
- Template quality - Are there BPMN, SIPOC, or Value Stream templates ready to use?
- Export and integration - Can you get your diagram into other tools without losing formatting?
- Bridge to execution - Does the tool help you actually run the process, or just draw it?
Every tool below was tested hands-on. No vendor demos, no marketing screenshots.
Quick comparison
The matrix below sorts the 14 tools by what they’re actually good at, not what their marketing pages claim. Read the “Runs processes” column first, because that’s where most teams discover the real gap. Diagram tools draw. Workflow tools execute. The two columns aren’t substitutes for each other, they’re different jobs. The 2024 BPMN 2.0 specification at OMG is the standard the “Full” entries below conform to.
| Tool | Best for | Free tier | Collaboration | BPMN support | Runs processes |
|---|---|---|---|---|---|
| Draw.io | Free diagramming | Unlimited | Via cloud storage | Basic | No |
| Lucidchart | Professional diagrams | Limited | Real-time | Full | No |
| Miro | Visual brainstorming | 3 boards | Real-time | Basic | No |
| Microsoft Visio | Technical documentation | No | Via SharePoint | Full | No |
| Creately | Visual collaboration | Limited | Real-time | Full | No |
| SmartDraw | Automated formatting | Trial only | Yes | Full | No |
| EdrawMax | Offline diagramming | Trial only | Limited | Full | No |
| ClickUp | All-in-one project work | Generous | Real-time | Basic | Partial |
| Canva | Non-technical users | Yes | Real-time | No | No |
| Notion | Documentation-first teams | Yes | Real-time | No | No |
| Pipefy | No-code workflow | Limited | Yes | Basic | Yes |
| Camunda | Developer-led automation | Open source | Yes | Full native | Yes |
| ProcessMaker | Enterprise orchestration | Trial | Yes | Full native | Yes |
| Tallyfy | Running processes | Trial | Yes | Conceptual | Yes |
14 process mapping tools reviewed
A lot of these listicles read like every tool is a serious switching candidate for everything else. The data tells a different story. Of 28 process-mapping and brainstorming tools we tracked across 44,859 trial signups, nine generated zero “we used to be on this” mentions in our records: Draw.io, SmartDraw, EdrawMax, FigJam, MindMeister, Coggle, TheBrain, Lucidspark, and Whimsical. People talk about leaving Visio. They talk about leaving ClickUp and Notion. When TechCrunch covered Camunda snaring $98M Series B in 2021, the BPMN engineers paid attention. The long tail almost never comes up at all. That doesn’t make those tools bad. It means they serve different jobs from Camunda or ProcessMaker. Read each review with that lens. The category isn’t one race.
1. Draw.io (diagrams.net) - Best free option
Draw.io is the tool I point people to when they say “I just need a quick diagram and I don’t want to pay for anything.” It delivers on that promise.
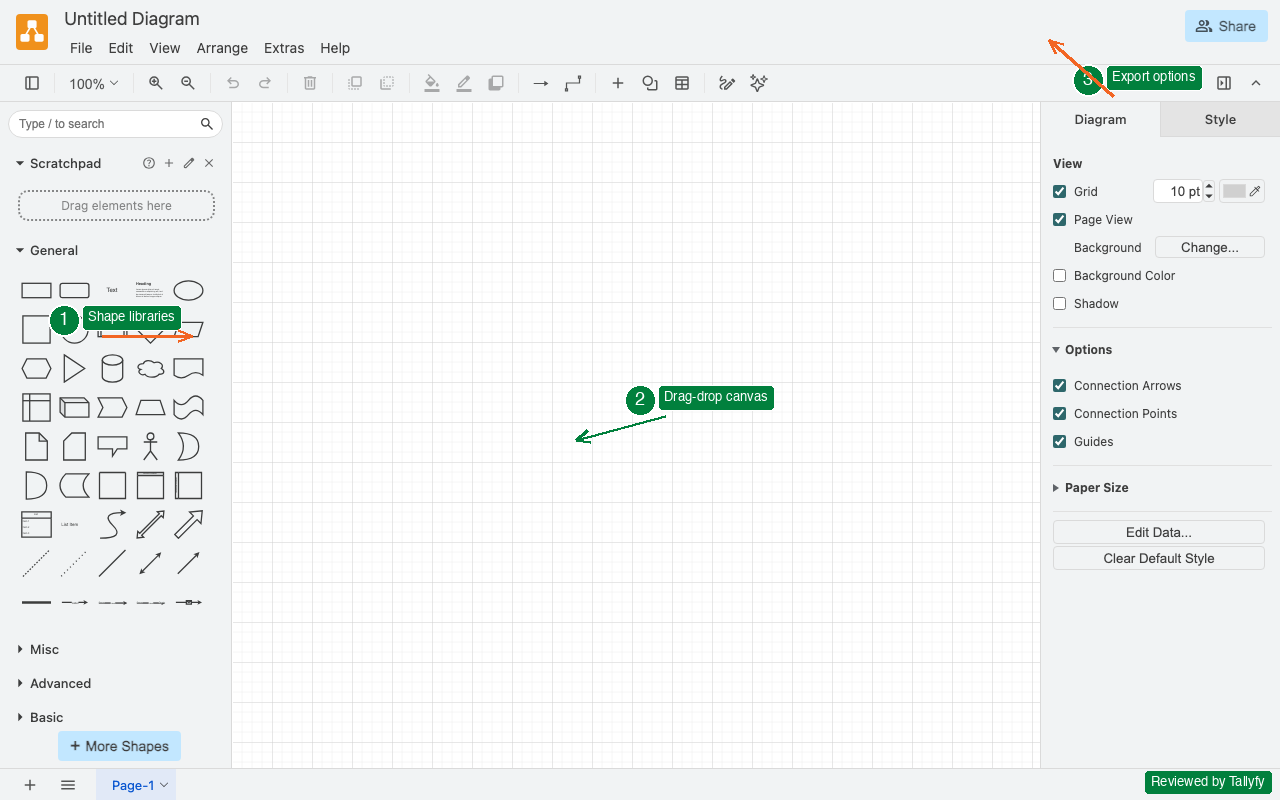
Open it in your browser. Start dragging shapes. Save to Google Drive, OneDrive, or locally. Done. No account required, no trial that expires, no features locked behind a paywall. The CISA cybersecurity team even uses it internally for network mapping.
A question that keeps coming up in discussions we’ve had: can Draw.io handle serious BPMN work? Sort of. It has BPMN shape libraries, but it won’t validate your notation or catch errors the way dedicated tools will. For quick process flowcharts and internal documentation, it’s brilliant. For ISO-compliant process documentation, you’ll hit walls.
Pros: Totally free, no account needed, integrates with Confluence and Google Drive
Cons: Sharing requires cloud storage workarounds, no process execution capability
2. Lucidchart - Best for professional collaborative diagramming
Lucidchart was purpose-built for diagramming, and it shows. Charles Huang and Ben Dilts launched it in 2010 specifically because Visio felt stuck in the 1990s. Sixteen years later, Lucid’s own About page cites 100M+ individual users and 99% Fortune 500 penetration. It’s still the tool most teams reach for when they need professional-grade diagrams with real-time collaboration.
The template library is extensive. BPMN 2.0, SIPOC, Value Stream Mapping, swim lane diagrams, network architectures. You name the diagram type, Lucidchart probably has a template for it. The real-time co-editing works well enough that two people can map a process simultaneously without stepping on each other’s work.
Where it falls short: Lucidchart draws things. It does not run things. Your finished diagram is still a picture. Nobody gets assigned a task, no deadline fires, no progress gets tracked.
Pros: Extensive template library, real-time collaboration, multiple export formats (PDF, PNG, Visio)
Cons: Per-user pricing adds up for larger teams, no process execution
- 3 editable documents
- 60 shapes per document
- Unlimited documents
- Collaboration features
3. Miro - Best for visual team brainstorming
Miro is less a process mapping tool and more an infinite digital whiteboard that happens to do process mapping reasonably well. Miro’s own About page lists 100M+ users in 250,000 organizations, including Nike, IKEA, Deloitte, WPP, and Cisco. People use it for everything from retrospectives to customer path maps.
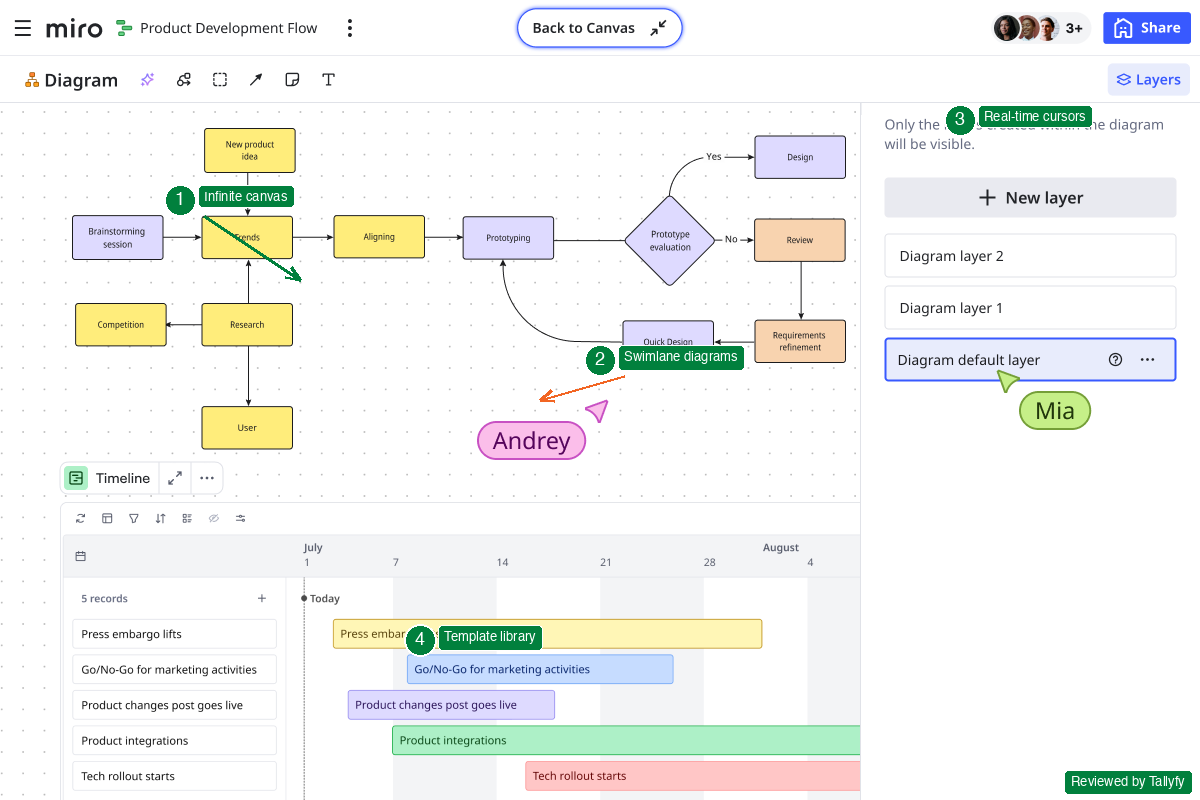
The infinite canvas is useful for early-stage process discovery. Throw sticky notes everywhere, group them, draw connections, then refine into a proper flowchart. It’s messy and that’s the point. The best process maps often start as collaborative chaos.
But Miro isn’t where you build serious BPMN diagrams. The process mapping templates are basic compared to Lucidchart or Visio. Think of it as the brainstorming stage before you formalize anything.
Pros: Infinite canvas, 1000+ templates, excellent real-time collaboration for large groups
Cons: Basic process mapping compared to dedicated tools, gets expensive per-seat at scale
- 3 editable boards
- AI Workflows included
4. Microsoft Visio - Best for Windows-only technical documentation
Visio is the grandparent of process mapping software. It’s been around since 1992 and remains deeply embedded in enterprises that run on Microsoft infrastructure.
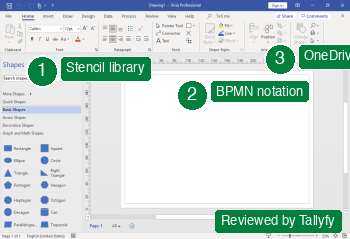
The stencil library is enormous. The BPMN support is thorough. The OneDrive and SharePoint integration works smoothly if your organization already lives in Microsoft 365. For formal technical documentation, especially in regulated industries where notation standards matter, Visio is hard to beat.
The counterintuitive part: despite being the most established tool on this list, Visio feels increasingly dated. Windows-only. No native mobile support. The web version exists but lacks key features. If your team includes Mac users or remote workers on various devices, Visio becomes a constraint rather than an enabler.
Microsoft Visio
Legacy diagramming tool locked to Windows ecosystem
Pros: Massive stencil library, deep Microsoft 365 integration, strong BPMN 2.0 support
Cons: Windows-only desktop app, no Mac support, web version is limited
- Web app only
- Desktop + web app
5. Creately - Best for visual process collaboration with data
Creately started as a simpler Lucidchart alternative but has evolved into something more interesting. Their visual canvas now connects shapes to underlying data, so your process diagram isn’t just a picture. Each shape can hold custom fields, links, and context.
Amanda Athuraliya’s team at Creately has pushed hard on the AI angle. Their Creately VIZ feature converts text descriptions into visual diagrams. Write “customer submits a support ticket, it gets triaged, then assigned to an agent” and the tool generates a flowchart. It’s not perfect, but it’s faster than dragging shapes manually.
What makes Creately different from Lucidchart: the data layer. Every shape on the canvas can hold custom data fields, links, and attachments. Your process map isn’t just a picture. Each step contains the documentation, metrics, and context that make it actionable. The pricing model is also unusual. Instead of per-user pricing that scales linearly, Creately offers unlimited users at fixed team pricing. For larger organizations, that math works out much better than Lucidchart or Miro.
Pros: Data-connected visual canvas, AI diagram generation, unlimited-user pricing option
Cons: Less established brand than Lucidchart, smaller integration ecosystem
- 3 workspaces
- Limited shapes
6. SmartDraw - Best for automated diagram formatting
SmartDraw does something none of the other tools here do well: it automatically formats your diagrams as you build them. Add a shape and the entire layout adjusts. Delete a connection and everything reflows.
For people who hate fiddling with alignment and spacing (which is most people), this is a genuine time-saver. SmartDraw also includes over 4,500 templates covering everything from org charts to floor plans to BPMN diagrams.
The trade-off is flexibility. 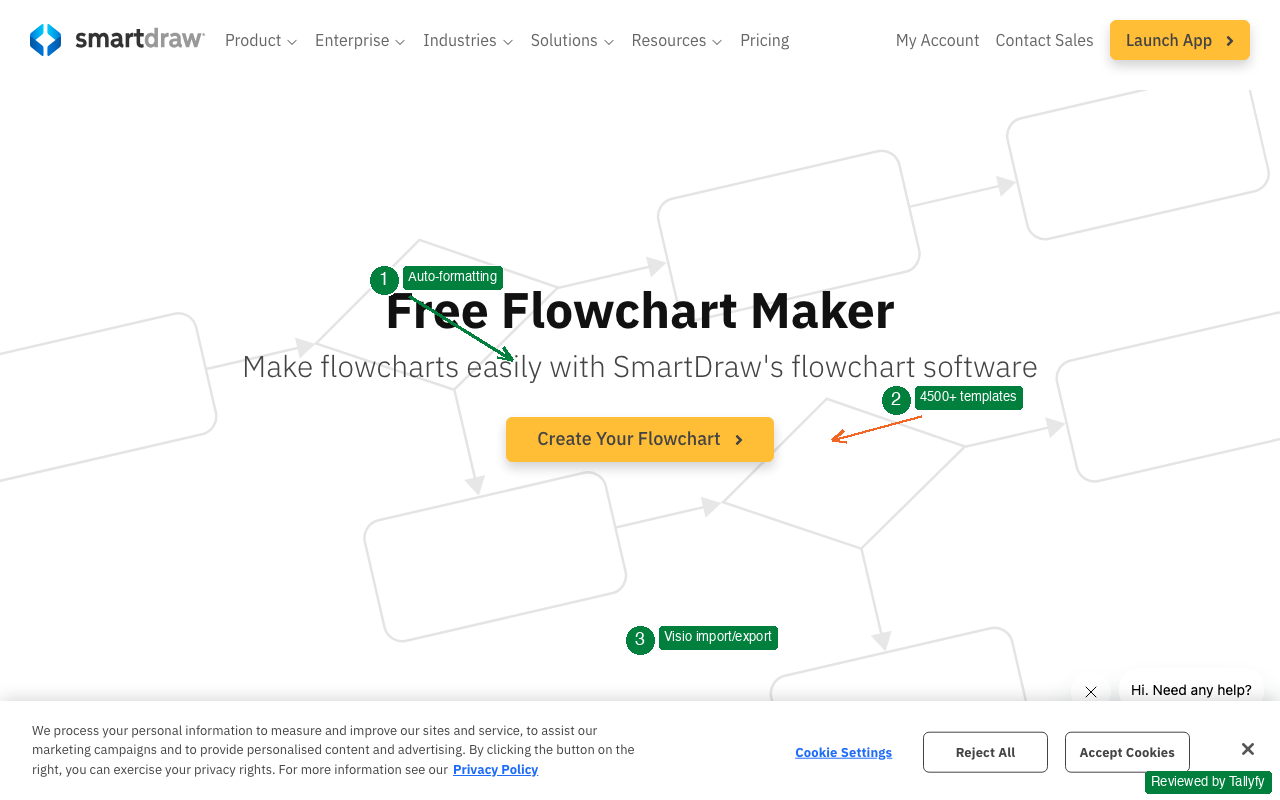
The auto-formatting means you have less control over exact positioning. If you need pixel-perfect diagrams for a presentation, Lucidchart or Visio give you more control. But if you just want a clean, properly formatted process map without fighting the software, SmartDraw gets you there faster.
Pros: Automatic formatting saves hours, massive template library, Visio import/export
Cons: Less manual control over layout, no free tier beyond trial
- Collaboration features
- Volume discount
7. EdrawMax - Best for offline diagramming on any platform
EdrawMax from Wondershare targets users who want a Visio-like experience without the Windows lock-in. It runs on Mac, Windows, and Linux, with a web version as backup.
The diagram types are extensive. Over 280 categories covering everything from flowcharts and org charts to P&ID (piping and instrumentation diagrams) and electrical circuits. For engineering teams that need technical process documentation beyond standard BPMN, EdrawMax covers ground that most competitors skip. The one-time purchase option is worth noting. While most tools on this list charge monthly per user, EdrawMax offers a lifetime license. For organizations that hate subscription creep, that’s a genuine differentiator.
One misconception we see constantly: people assume cross-platform diagramming tools sacrifice quality for compatibility. EdrawMax doesn’t. The desktop app is capable.
Pros: Cross-platform (Mac, Windows, Linux), 280+ diagram categories, one-time purchase option
Cons: Desktop-first design means collaboration features lag behind cloud-native tools, less intuitive than Lucidchart
8. ClickUp - Best all-in-one platform with process mapping built in
ClickUp is a project management platform that includes whiteboard and mind map features for process mapping. It’s not a dedicated diagramming tool. It’s a work management platform that happens to include diagramming.
The advantage: your process map lives next to your tasks, docs, and goals. You can draw a workflow on the whiteboard and link shapes directly to ClickUp tasks. That’s a step closer to bridging the mapping-to-execution gap than most pure diagramming tools manage.
The disadvantage: the diagramming features are basic compared to Lucidchart or Visio. No BPMN templates, no advanced notation support. If process mapping is your primary need, ClickUp’s whiteboard will feel limited. But if you already use ClickUp for everything else, adding basic process maps without switching tools has real value.
ClickUp
All-in-one project management with basic process mapping
Pros: Process maps live alongside tasks and docs, generous free tier, huge integration library
Cons: Basic diagramming compared to dedicated tools, no BPMN support
- 100MB storage
9. Canva - Best for non-technical users who need quick visuals
Canva is a design tool, not a process mapping tool. But it shows up in this list because millions of people use it to create simple flowcharts and process diagrams without learning specialized software.
The drag-and-drop interface is the easiest on this list. If your goal is a clean-looking flowchart for a presentation or internal wiki, and the person creating it has zero diagramming experience, Canva gets the job done. The template library includes basic flowchart and process templates.
What Canva can’t do: anything technical. No BPMN notation. No data connections. No process validation. It’s purely visual. Treat it as the entry ramp, not the highway. That said, Melanie Perkins and Cliff Obrecht built Canva to make design accessible to non-designers, and for that specific use case, it’s unbeatable. If your operations manager needs to create a flowchart for a team meeting and has never heard of Lucidchart, Canva gets them from zero to done in 15 minutes.
Canva
Design platform with basic flowchart templates
Pros: Easiest learning curve of any tool here, beautiful output, massive free tier
Cons: No BPMN or process-specific features, purely visual with no execution capability
10. Notion - Best for documentation-first process mapping
Notion doesn’t draw diagrams natively. But it handles process documentation so well that many teams use it as their primary process mapping tool. Instead of flowcharts, they write structured documents with databases, toggle lists, and linked pages.
Does that count as process mapping? Sort of, yeah. If your processes are better described as procedures (do this, then this, then check that), Notion’s document-centric approach can be more useful than a flowchart. The embedded databases let you track process owners, review dates, and version history.
For visual process maps, you’ll need to embed diagrams from another tool (Miro, Lucidchart, or Draw.io all integrate with Notion). That’s a valid workflow, but it’s two tools instead of one. Ivan Zhao and Simon Last designed Notion around the concept of tools that compound over time. A process database in Notion accumulates context, history, and linked documentation that a standalone diagram tool can’t match. If your team already lives in Notion for documentation and project management, adding process maps as embedded diagrams is less disruptive than adopting a separate tool.
Notion
Documentation platform that handles process documentation differently
Pros: Excellent for written procedures, databases track process metadata, strong integrations
Cons: No native diagramming, visual process maps require embedded third-party tools
11. Pipefy - Best no-code workflow builder with visual mapping
Pipefy sits between diagramming tools and full workflow platforms. You build processes visually using a Kanban-inspired interface, then those processes actually run. Cards move through stages, forms collect data, automations trigger actions.
The process mapping happens implicitly. Instead of drawing a flowchart and then separately building a workflow, you design the workflow directly. The visual representation is the working process.
For operations teams who want to stop drawing diagrams and start running processes without writing code, Pipefy fills a real gap. It’s not as visually flexible as Lucidchart for creating diagrams, but it’s dramatically more functional for executing work.
Pipefy
No-code workflow automation with visual process building
Pros: Processes run immediately after mapping, Kanban-style visual builder, no code needed
Cons: Limited diagramming flexibility, less suitable for complex BPMN notation
- 5 processes
12. Camunda - Best for developer-led process automation
Camunda is built for engineers. If the other tools on this list are consumer-friendly diagram editors, Camunda is the industrial-grade process engine underneath.
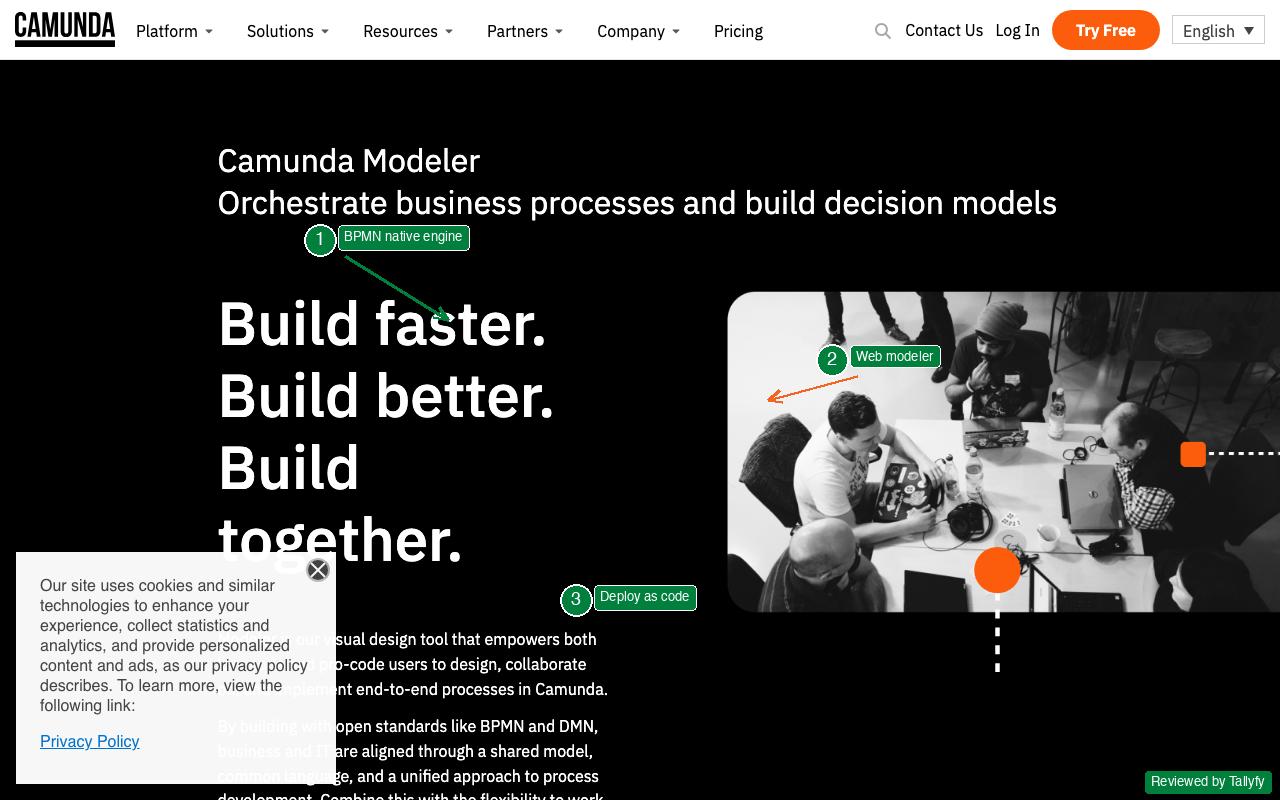
Founded by Jakob Freund and Bernd Ruecker in Berlin, Camunda executes BPMN processes programmatically. You model a workflow in their web modeler, then deploy it as executable code. The process engine handles routing, error recovery, parallel execution, and monitoring.
This isn’t a tool for operations teams who want to draw flowcharts. It’s for development teams who want to orchestrate complex, long-running business processes across microservices. The learning curve is steep. The payoff is enormous if you need that level of control.
A mistake we made early on was underestimating how many organizations need this developer-centric approach. Financial services and insurance companies, where process compliance is non-negotiable, gravitate toward Camunda for exactly this reason.
Pros: Production-grade BPMN engine, open-source core, handles complex orchestration
Cons: Requires developer skills, overkill for simple process mapping, steep learning curve
Camunda
Developer-led BPMN execution engine for engineering teams
- Self-managed, community support
13. ProcessMaker - Best for enterprise workflow orchestration
ProcessMaker targets large organizations that need to automate complex, multi-department workflows with compliance requirements. Their Customers & Support page describes the typical use cases as insurance claims processing, bank loan approvals, and government permit applications.
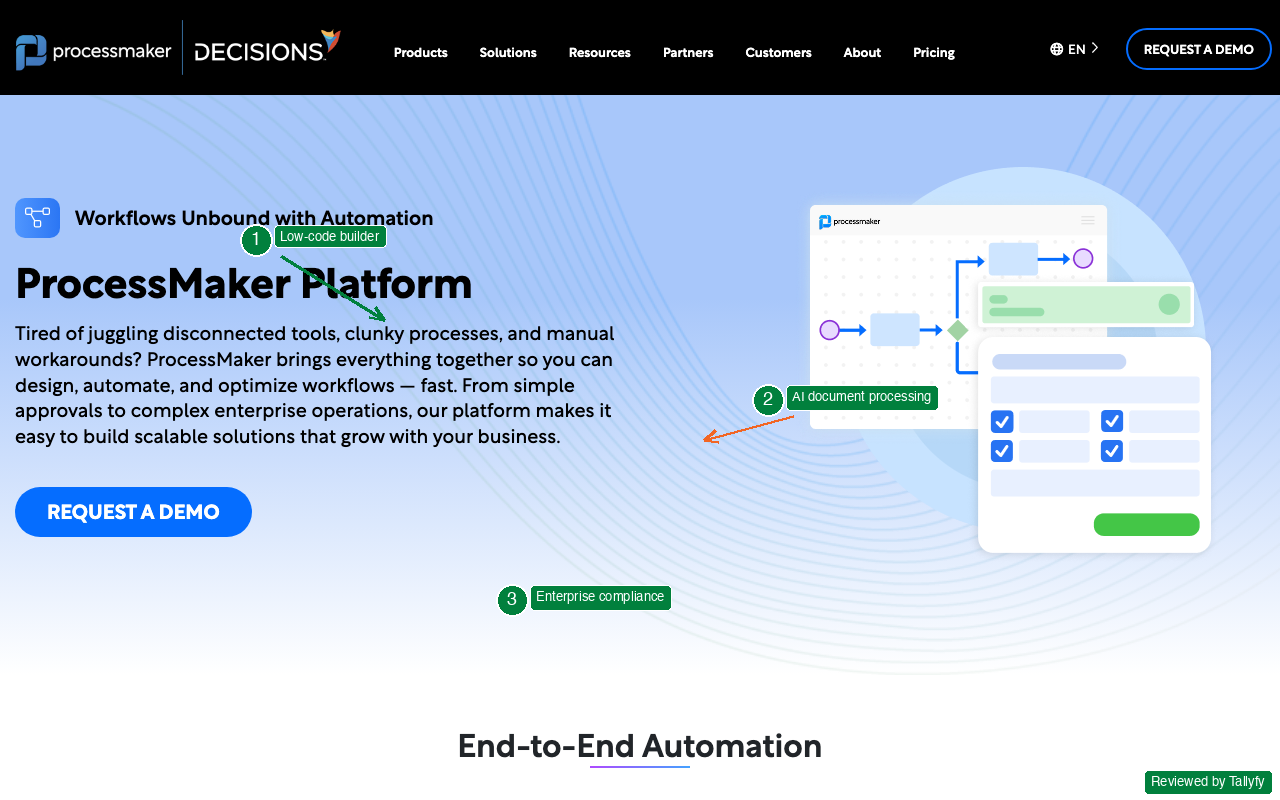
The BPMN modeler is visual enough for business analysts to design processes, but capable enough to include conditional logic, parallel branches, and external system integrations. The platform runs on low-code principles, meaning non-developers can configure most automations without writing code.
Where ProcessMaker stands out from Camunda: it’s more accessible to non-technical users. Where it falls short: it lacks the deep developer customization that engineering teams want. Pick based on who’s building your processes.
Pros: Low-code BPMN modeler, enterprise compliance features, AI-powered document processing
Cons: Enterprise pricing not transparent, heavier implementation than simpler tools
ProcessMaker
Enterprise low-code BPM platform with compliance focus
Expect sales calls and unpredictable costs. Hard to budget or compare.
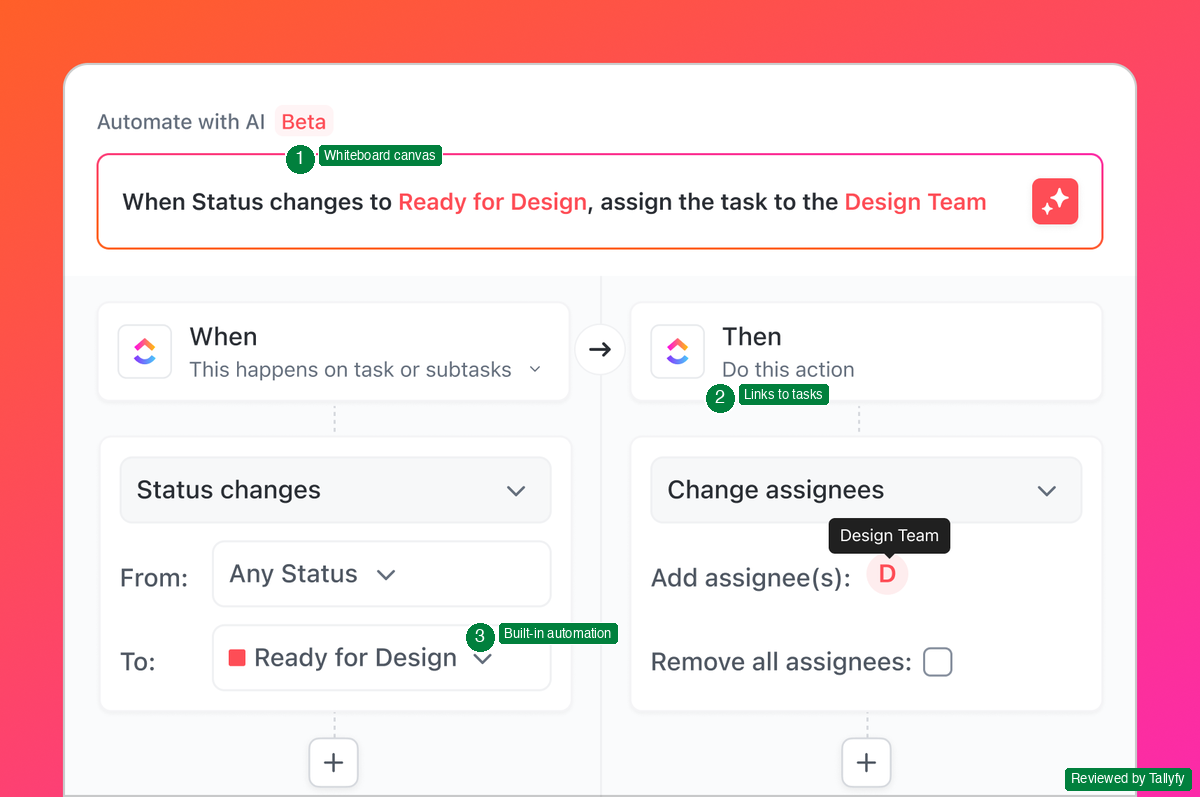
See Tallyfy's transparent pricing instead14. Tallyfy - Best for running processes instead of drawing them
Here’s a real example of what an executable process looks like:
Tallyfy isn’t a diagramming tool. It’s a workflow execution platform. Instead of drawing a picture of your process, you build the actual digital process. Then it runs.
When step one finishes, step two gets assigned automatically. Deadlines are tracked. Progress is visible to everyone. Nobody needs to chase anyone in Slack asking “did you finish that thing?”
The biggest lesson from our own experience building Tallyfy: teams across financial services (17% of implementations), healthcare (11%), and professional services (10%) discovered that the real value isn’t in drawing workflows. It’s in running them.
AI agents need structured workflow patterns to operate. Sequential steps, parallel branches, evaluation loops. A static Lucidchart diagram can’t give an AI agent those patterns. A living process in Tallyfy can. That distinction matters more every quarter as AI adoption accelerates.
Pros: Real-time process tracking, automatic task assignment, AI-ready workflow infrastructure
Cons: Not designed for creating standalone diagrams, requires team adoption
The gap between mapping and doing
This is where most teams get stuck. They treat process mapping as the finish line. It isn’t. When 4,624 trial signups answered “which process do you want to improve first,” 1,973 of them, that’s 43 percent, chose client onboarding. Employee onboarding came second at 1,715. Both of those workflows live or die on whether someone actually completes step seven on time, not on whether the diagram of step seven is pretty.
Process mapping is one step inside Business Process Management. The map is useful. But a map without execution is wall art. You wouldn’t hang a blueprint and call the house built. So why do teams create process diagrams and act surprised when nothing changes?
If your process is broken and you automate it, you break things faster and at higher volume. That’s why defining processes properly is a prerequisite for any AI or automation project. Not optional. Not nice-to-have.
Are your maps actionable?
Drawing the map and running the work are not the same task, and the cost gap between them gets bigger every quarter. A pretty Lucidchart export saved as PDF teaches the team nothing the next time someone misses a handoff. An executable workflow with named owners, deadlines, and visible status turns the same diagram into a thing that produces outcomes. Before you commit to any tool on this list, walk through the calculator below. Drop in your team size, your average process length, your hourly rate. The output shows the gap between “we have a flowchart” and “we have a process that finishes itself” in dollars per quarter. Most teams underestimate it by a factor of four. Picking a diagram tool that can’t bridge to execution is rarely a budget problem. It’s a measurement problem because nobody priced the gap.
What busywork costs your company
per week
per year
over 5 years
How to pick the right tool
The choice depends on what job you’re hiring the tool to do. Before reading the picks below, sit with one number: Process Street alone shows up in 295 lead notes across our CRM. That’s more than Visio, Lucidchart, Miro, and Camunda combined. The substitute most operations leaders are weighing isn’t a better diagram tool, it’s a different category of tool entirely.
For a quick diagram for a meeting: Draw.io or Canva. Free, fast, no training needed.
For professional diagrams with team collaboration: Lucidchart or Creately. Templates, real-time editing, polished output.
For formal BPMN documentation under compliance: Visio, Camunda, or ProcessMaker. Standards-compliant, audit-ready.
For diagrams that nobody looks at: Tallyfy or Pipefy. Build the process once, run it forever, track everything automatically.
For a one-time purchase: EdrawMax. No subscriptions, no per-user fees, runs on Mac, Windows, and Linux.
For BPMN execution, not just drawing: Camunda. Deploys diagrams as executable code, steep learning curve, big payoff for engineering teams.
The pattern we keep running into in discussions about process improvement: organizations start with a diagramming tool, realize the diagram doesn’t change behavior, then look for something that actually runs the process. Knowing the pattern in advance saves a step.
Start by running one process instead of mapping it
Types of process maps
Not all process maps serve the same purpose. Picking the right type matters as much as picking the right tool.
Basic flowchart: Steps connected by arrows. Good for linear processes. Every tool on this list handles these.
Swim lane diagram: Lanes for departments or roles. Shows where handoffs happen. Lucidchart, Visio, Creately ship templates. See our swim lane guide.
BPMN 2.0 diagram: Formal standard for process notation. Events, gateways, pools, message flows. Required for ISO compliance in some industries. Camunda, ProcessMaker, Visio, and Lucidchart support the full spec.
Value Stream Map: Borrowed from Taiichi Ohno’s Toyota Production System per the Lean Enterprise Institute primer on VSM. Lucidchart and SmartDraw ship VSM templates.
SIPOC diagram: Suppliers, Inputs, Process, Outputs, Customers. High-level view used in Six Sigma projects. See our SIPOC guide for the breakdown.
Frequently asked questions
The questions below come from the actual support inbox and CRM notes, not from a keyword tool. Across 9,793 customer conversations the recurring threads are pricing transparency, BPMN compliance for audited industries, integrations with the rest of the stack, and “I picked a tool last year and now nothing’s getting done, what do I switch to?” Each of those concerns shows up below. The seventh question, on whether you need BPMN at all, deserves a short answer rather than a long one because most teams don’t need it. The longer answers are reserved for when you do, and we link directly to the OMG BPMN 2.0 specification so you can verify the standard yourself rather than trust a vendor marketing page. Read the questions in order if you’re new to the category.
What is the best free process mapping tool?
Draw.io (diagrams.net) is the best free option. It’s unlimited, requires no account, and integrates with Google Drive and Confluence. For basic flowcharts, Canva’s free tier also works. Camunda’s community edition is free if you need enterprise-grade BPMN execution.
What is the difference between process mapping and workflow automation?
Process mapping draws a picture of how work flows. Workflow automation executes those steps with software, assigning tasks, enforcing deadlines, and tracking progress. Mapping is the blueprint. Automation is building the house. Tools like Tallyfy and Pipefy bridge both.
Can process mapping tools integrate with existing software?
Most tools integrate with common platforms. Lucidchart connects to Confluence, Jira, and Google Workspace. Miro integrates with Slack, Microsoft Teams, and Asana. ClickUp includes native process mapping alongside its project tools. Enterprise tools like Camunda connect to databases, APIs, and microservices.
Which process mapping tool works best for small teams?
Draw.io for free diagramming. Lucidchart for professional collaboration. Tallyfy for actually running processes. Small teams often benefit more from executable processes than static diagrams because there’s nobody to spare chasing follow-ups.
Is Microsoft Visio still worth using in 2026?
Visio remains capable for Windows-based teams in regulated industries that need formal BPMN documentation. But the Windows-only limitation, lack of mobile support, and dated interface make it hard to recommend for cross-platform teams. Lucidchart and Creately offer comparable features with broader device support.
How often should process maps be updated?
Every quarter at minimum, or whenever something material changes. New technology, new regulations, new team members. Digital tools make updates easier than paper. Based on feedback we’ve received from hundreds of implementations, quarterly reviews tend to work well. The best approach is using a tool that updates the map automatically when the process itself changes.
What is BPMN and do I need it?
BPMN (Business Process Model and Notation) is an international standard maintained by OMG for process diagramming. You need it if your industry requires auditable process documentation, if you’re working with process automation engines like Camunda, or if you need diagrams that different organizations can interpret consistently. For internal team workflows, simpler flowcharts usually work fine.
