Summary
- BPMN creates a universal process language - Without standardized symbols, process maps only make sense to their creators. BPMN gives you circles for events, rectangles for activities, and diamonds for gateways, so everyone from frontline staff to investors reads the same diagram the same way
- Four element types capture entire workflows - Flows (events, activities, gateways) show what happens, connections show relationships, swimlanes separate departments, and artifacts reference external data. Together they represent any business process end-to-end
- The real problem is adoption, not notation - Most teams don’t struggle with BPMN symbols. They struggle with the fact that static diagrams sit in a drawer and never get used. That’s exactly why we built Tallyfy to turn process maps into live, trackable workflows anyone can follow
- Need help getting started? Schedule a demo.
BPMN, or Business Process Model and Notation, is a standardized way to draw business processes so that anyone can understand the diagram without needing a decoder ring. That’s basically it. Circles mean events. Rectangles mean tasks. Diamonds mean decisions. If you’ve ever drawn a flowchart, you’re already halfway there.
But here’s the thing most people miss. The notation itself isn’t the hard part. In our experience with workflow automation, the hard part is getting people to actually use the diagrams once they’re drawn. A gorgeous BPMN map pinned to a SharePoint site that nobody opens is worth exactly nothing.
Business Process Management Made Easy
Why BPMN exists in the first place
Process maps can be wildly confusing. Without a single, shared standard for documenting processes, understanding any diagram requires knowing the specific notation that person chose to use. Running Tallyfy taught us that this confusion ranks as one of the most common complaints about how processes get documented.
One team at a global gold mining operation described their pre-automation state: managing 2,300 annual shipments worth over $200 million using Outlook, Excel spreadsheets, and shared folders, with no live reconciliation between payments and shipping documentation. Their messy 30-step customs workflow spanning multiple departments and external freight forwarders was nearly impossible to communicate. Period.
So, as a means of creating a universal standard for process mapping, business process modeling and notation was developed. It allows for a standardized way to map processes so every stakeholder understands what each symbol means. The methodology was developed by Stephen White and others at the Business Process Management Initiative (BPMI) and was known initially as “business process modeling notation.” In 2011, with the release of BPMN v2.0, the name changed to “Business Process Model and Notation.” The shift wasn’t just cosmetic - v2.0 added formal execution semantics, meaning the diagrams could theoretically drive automated systems, not just sit on a wall.
Running Tallyfy taught us that this promise of “executable diagrams” rarely materializes in practice, because the gap between a drawing and a running workflow is bigger than most people expect. As with the process flowcharts Frank Gilbreth introduced, BPMN is central to business process management (BPM). Michael Hammer helped define the discipline, and it remains one of the most popular process improvement methods. But being central doesn’t mean it’s sufficient - a diagram is a starting point, not a finish line. Can a diagram alone run a process? No.
Benefits, and the real limitations
While process modeling isn’t anything new, it tends to have its flaws. The concept can be vague because there’s no single way to do it. Everyone can create a process map. Making it easy to understand for everyone? That’s hard. And it won’t get easier by pretending the problem doesn’t exist.
In 99% of cases it is a solution in search of a problem, peddled by an expensive consultant with a shiny slide deck.
In a large organization, this vagueness becomes a real problem. You’d want the management, field employees, process improvement experts, and outside stakeholders to all look at the same process map and actually understand it. Even if your organization has its own internal symbols, you’d probably still have a hard time getting external consultants or investors to follow along. They won’t be keen to learn your custom notation just for one meeting.
At Tallyfy, we’ve seen this communication gap firsthand. Operations teams consistently highlight it as a major pain point. When one technology team evaluated 21 different process management solutions, they specifically tested whether non-technical users could understand the notation. They rated simplicity for non-technical users separately from technical depth, and found most BPMN tools scored poorly on one dimension or the other. Not exactly a ringing endorsement.
That’s the whole appeal of BPMN. It gives you a shared visual vocabulary. But it’s also where the disconnect happens, because knowing the vocabulary doesn’t mean people will actually use it day-to-day.
Turns out, process quality is the ceiling for AI performance. And a BPMN diagram that nobody follows is just a bad process with pretty shapes.
Want the benefits of BPMN without training your entire company on notation? Certain workflow systems come with intuitive process mapping that anyone can understand in minutes, not months.
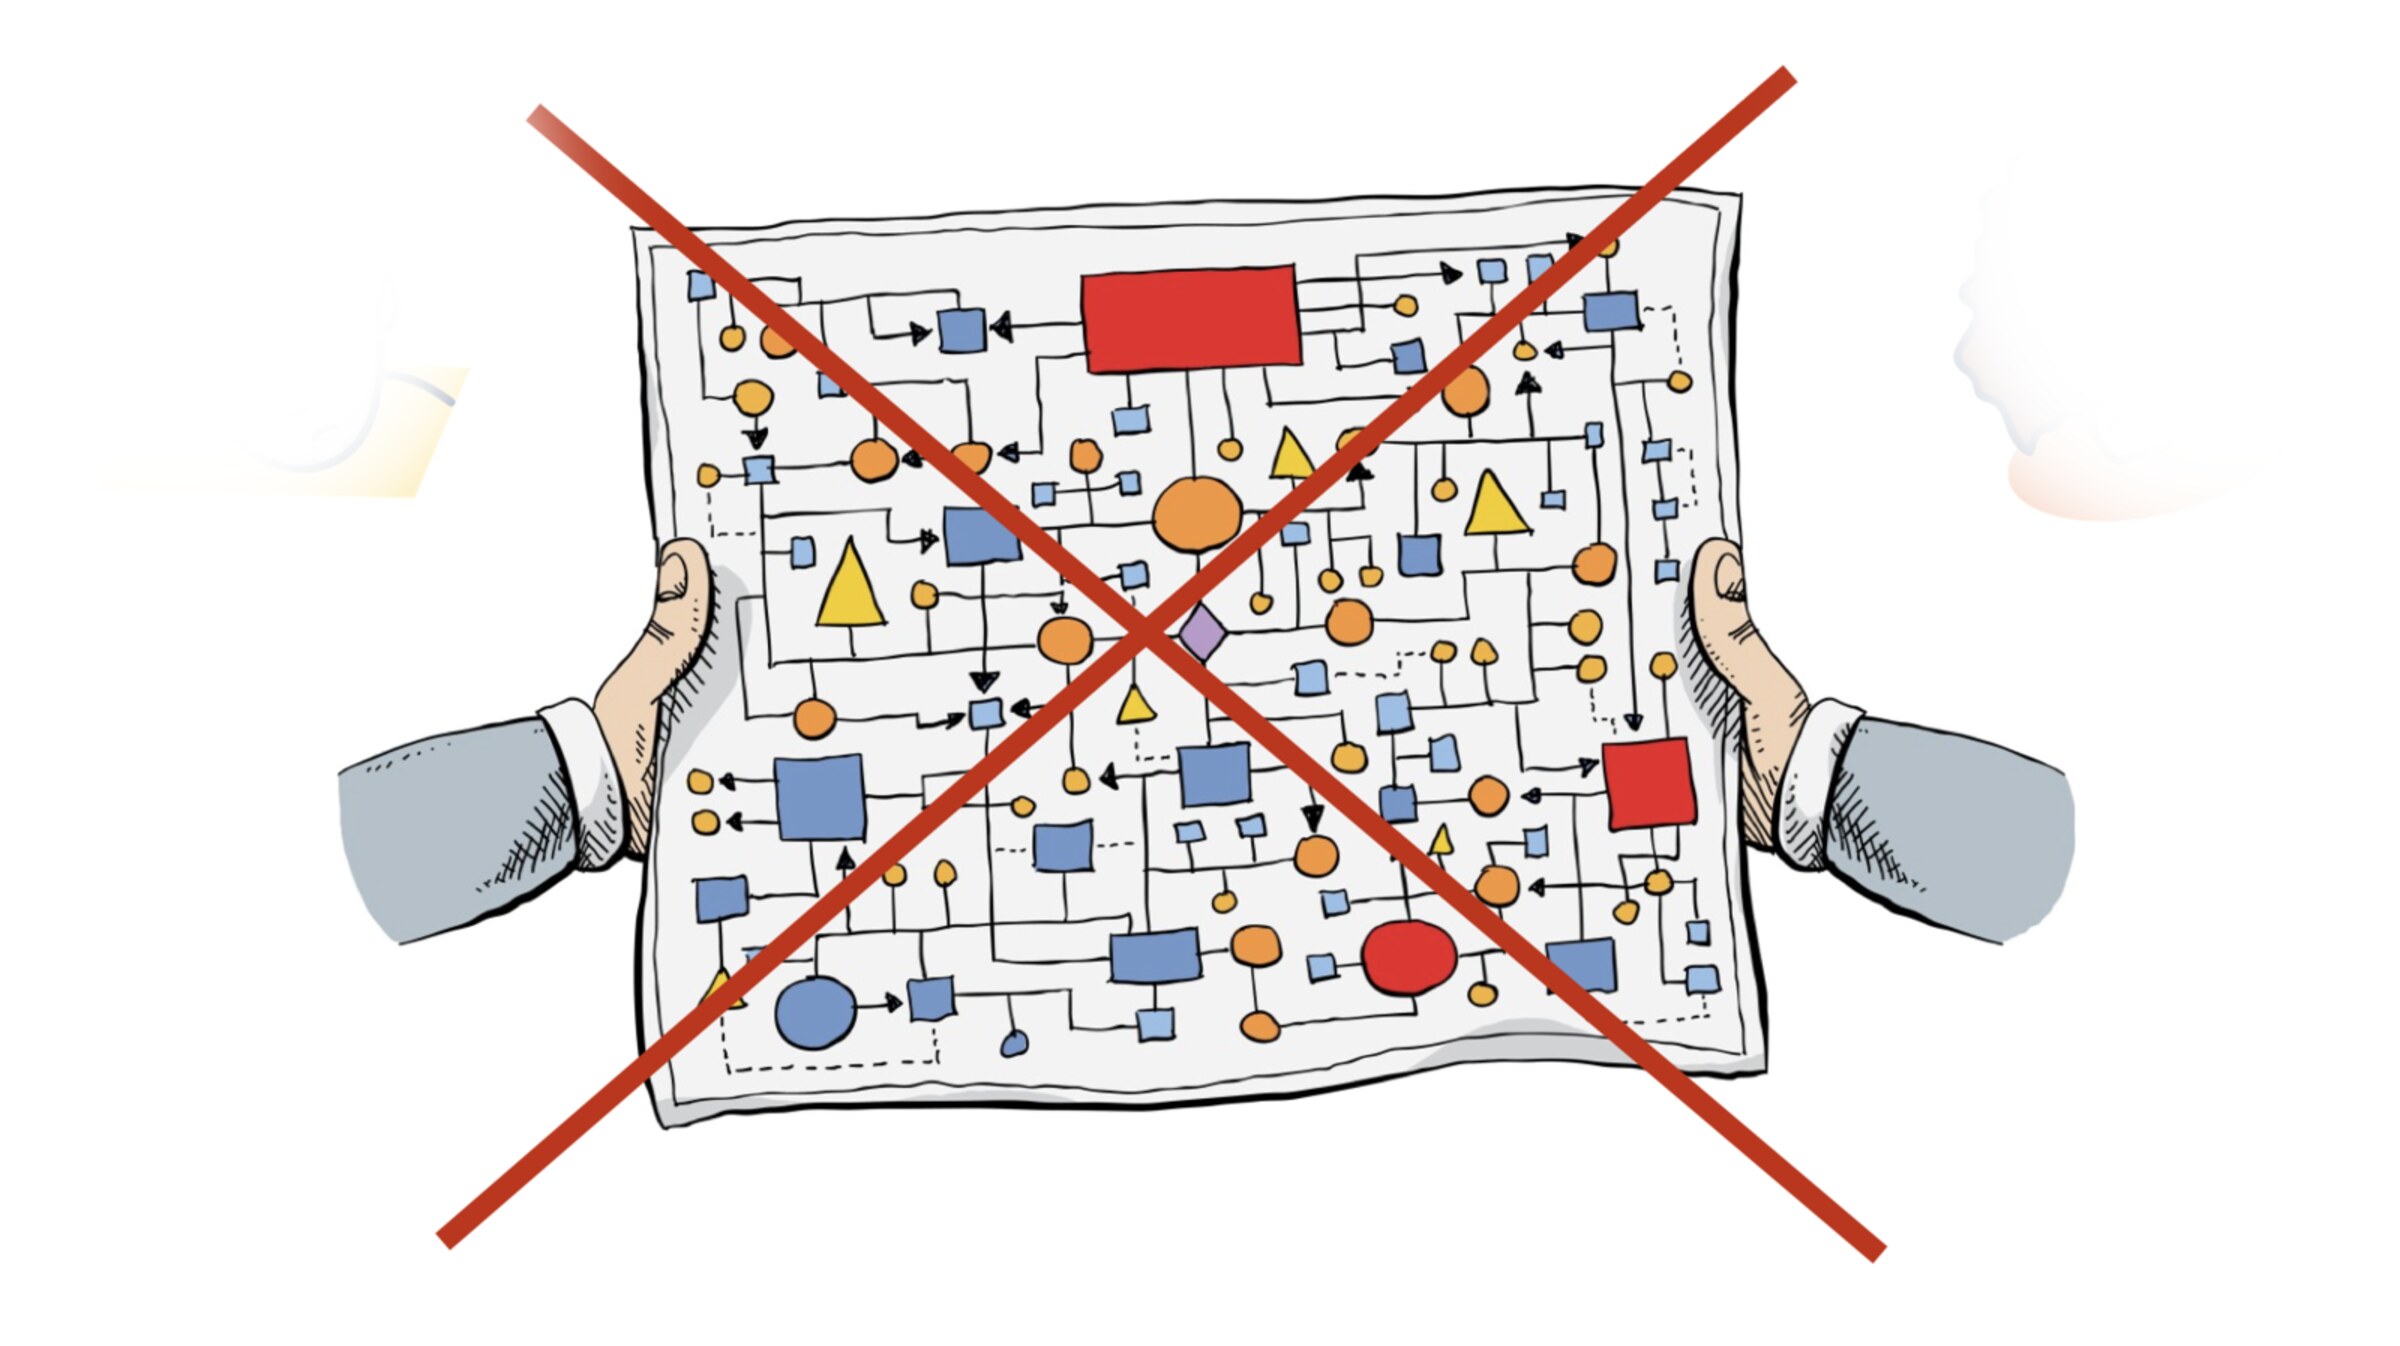
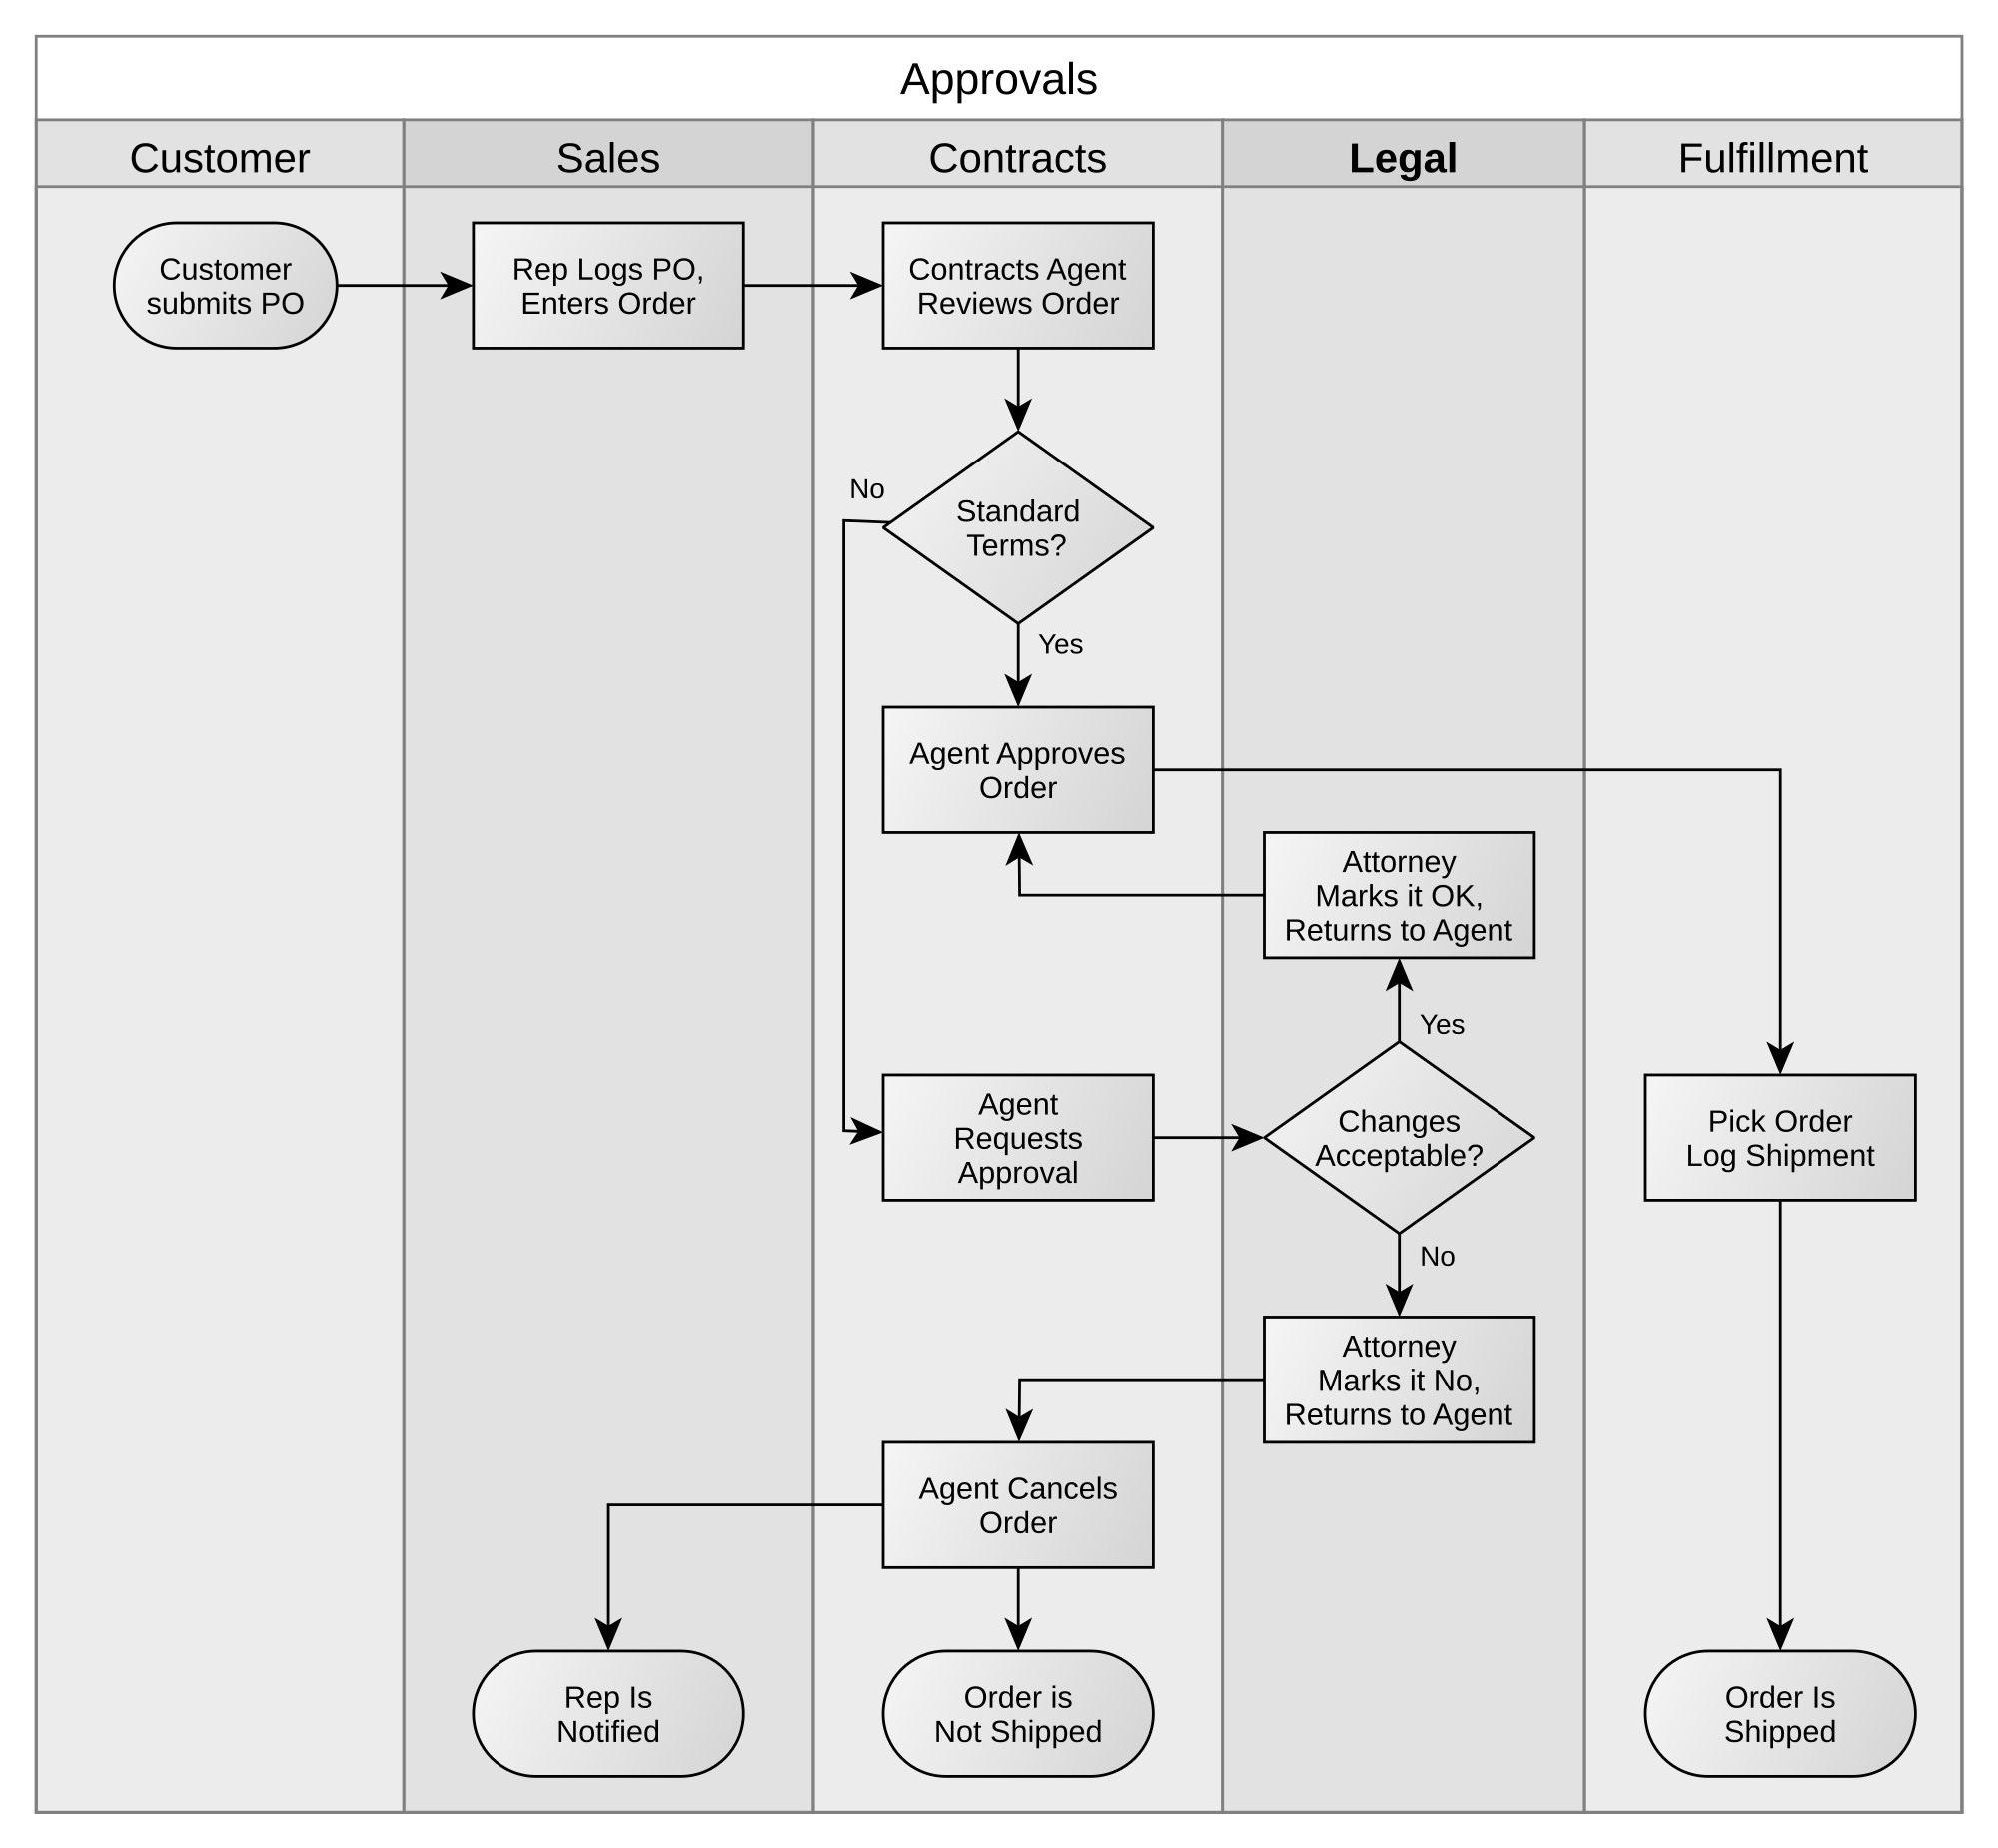
Legacy BPM dies the moment your team sees a diagram like this. Tallyfy is the alternative.
BPMN 2.0 elements and symbols
Since BPMN aims at standardization, only specific graphical representations are used for different activities. Once you’ve picked up this graphic “language,” you can grasp what’s going on in any workflow diagram at a glance.

The four different element types are:
Flows: events, activities, and gateways
Connections: sequence flow, message flow, and association
Swimlanes: pool or lane
Artifacts: data object, group, annotation
Here’s how each works.
Flows
Events
The BPMN model begins and ends with events, and there’ll be several intermediate events in between.
An event is something that happens. It’s not a task or activity.
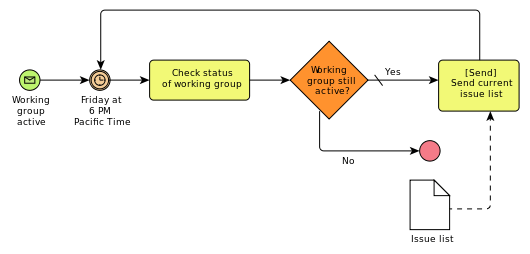
Events are represented by circles. An ordinary circle is the starting point. A circle with a double border indicates an intermediate event, and a bold circle represents an endpoint.

Within the circle, an icon shows what happened.
For example, the classic envelope icon indicates a message. But these events also have nuances. You might receive a message, or you could be sending one. These two nuances are captured in the terms “catching” and “throwing.”
When an event starts a process, it’ll always be a “catch.” The final step will always be “throw” and the intermediate events are either “throw” or “catch.”
Activities
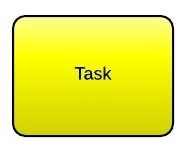
A task or activity carried out by either a person or software.
Activities are depicted as rectangles with rounded corners.
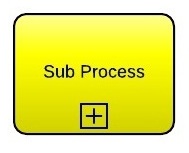
Some activities are single tasks that stand alone, but others are compound activities consisting of several sub-processes.
Compound activities aren’t always obvious at first glance. Using BPMN software, you can show or hide these. You’ll know there are sub-processes in an activity thanks to a plus icon at the bottom of the rectangle. Click it, and a diagram showing all the sub-processes, flows, connections, and artifacts shows up.
BPMN seems quite fun and simple at first. Seems like you are adding value, but in reality it is really a serious tech debt when you need to maintain or scale up later.
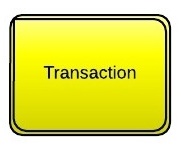
The term “transaction” indicates activities where every single step is so closely related that failing in one step would undo all the work inside the compound activity. To indicate a transaction, you use a double border.
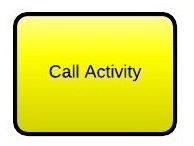
Finally, there are call activities: activities where a global task is reused. The rectangle gets a bold border.
Gateways
A gateway is a conditional element and is indicated by diamonds. There are several different types:
- Exclusive gateways move workflows from one route to another. They indicate there’s only one option.
- Event-based gateways depend on something other than the task happening.
- Parallel gateways run two paths side by side without depending on an event.
- Inclusive gateways, complex gateways, and parallel event-based gateways each have their own symbol and usage rules.
Why does everyone treat gateways as the simple part? They’re actually where most BPMN diagrams fall apart, because real decisions are rarely as clean as a diamond with two arrows.
Connections
Different kinds of flows, each represented differently:
- A solid line with an arrowhead shows how flows happen in sequence.
- Message flows show lines of communication, represented by a dashed line with a throw and catch symbol at each end.
- Association flows show how an artifact or text relates to a flow. Direction can be indicated by an arrow, but not when the flow is associated with a message.
Swimlanes
Sometimes different departments, or even different organizations, need to work together to get something done. The pool consists of the functions or organizations who participate, and each gets their own swimlane. Inside each lane, there are flows, objects, and artifacts.
Artifacts
Artifacts show there’s information that must be referenced outside the BPMN diagram.
- A document icon shows that data is needed or that data is about to be produced.
- A rounded edge rectangle with a dotted border shows that activities form a group.
- Annotations revert to regular text to explain certain elements.
When BPMN is worth the effort, and when it isn’t
Here’s what I’ve learned after years of working on workflow automation: BPMN is useful when you need a shared visual language across departments, consultants, and stakeholders. For complex, cross-functional processes like compliance workflows in financial services or multi-department onboarding, the standardized notation pays for itself.
Actually, that oversimplifies it. But for most teams? The overhead of learning and maintaining BPMN diagrams outweighs the benefit. We’ve observed that operations teams want to track and run their processes, not just draw them. A BPMN diagram doesn’t tell you who’s late on step 7 or which approval has been stuck for three days.
This drives me crazy. Teams spend weeks perfecting a diagram and then go right back to managing the actual work in email and spreadsheets.
If you’re looking for tools that handle process modeling without the steep learning curve of traditional BPMN, modern BPM software offers visual builders that anyone can use. No training required.
How Tallyfy replaces static BPMN diagrams
Instead of mastering circles, diamonds, and swimlanes, Tallyfy lets you build and track real workflows that anyone can understand immediately. Here’s an example of a process that would traditionally require extensive BPMN diagramming. Notice how the steps naturally flow between departments (HR, IT, Office Manager, Manager) without needing specialized symbols:
The most important part is this: what does Tallyfy offer that BPMN doesn’t?
Live tracking. Real accountability. Actual execution. A BPMN diagram is a picture. Tallyfy is the thing that makes the picture actually happen, every single time.
Agents are getting smarter. The workflows they need haven’t been built yet. That’s the gap Tallyfy fills: giving both people and AI agents a clear, trackable process to execute rather than a static diagram to admire.
