Swim lane diagrams answer a question every team struggles with: who’s responsible for what? Here’s how we approach process documentation at Tallyfy.
Summary
- Visual lanes prevent departmental chaos - Each department gets its own lane in the diagram, making it impossible to ignore who owns every step, where handoffs happen, and which bottlenecks are grinding work to a halt
- Keep it between 4 and 12 entities - Too few lanes make the diagram pointless, too many create a visual mess nobody can follow
- Five real benefits solve real problems - Clarifies complex processes through visualization, improves cross-department communication, identifies all participants and their sequence, offers flexible perspectives for different audiences, and spots errors mid-process before they snowball
- Static diagrams have serious limits - Word and Visio can build swim lanes, but they compress details onto one page, lack real-time communication channels, and ignore your actual org structure. See how Tallyfy tracks workflows without these constraints
Tallyfy is the only product available that does Process Documentation and Process Tracking in one
A swim lane diagram is a process flowchart that separates responsibilities into horizontal or vertical lanes, one per department, team, or role. That’s the short answer. If you’re mapping who does what across a multi-department process, this is probably the diagram you need.
We’ve observed something interesting in our conversations with mid-market operations teams. The moment someone draws swim lanes on a whiteboard, the confusion drops. Well, not all of it, but close enough. People stop talking past each other. An operations lead at a food manufacturing company put it plainly during one of our discussions: “We want to create swim lanes so we know what we’re doing.” That captures the appeal spot on.
The swim lane concept first surfaced in the 1960s. Turns out, it’s stuck around because it works. Like any flowchart, it maps a process from start to finish, but the lanes add a layer of accountability that plain flowcharts miss.

Every swim lane rollout ends the same way. One champion. Zero adoption. There is a simpler path.
What is a swim lane diagram
Swim lane diagrams are used in multi-department organizations to illustrate how teams cooperate on a business process. Departments appear in vertical lanes and objectives flow horizontally, or vice versa.
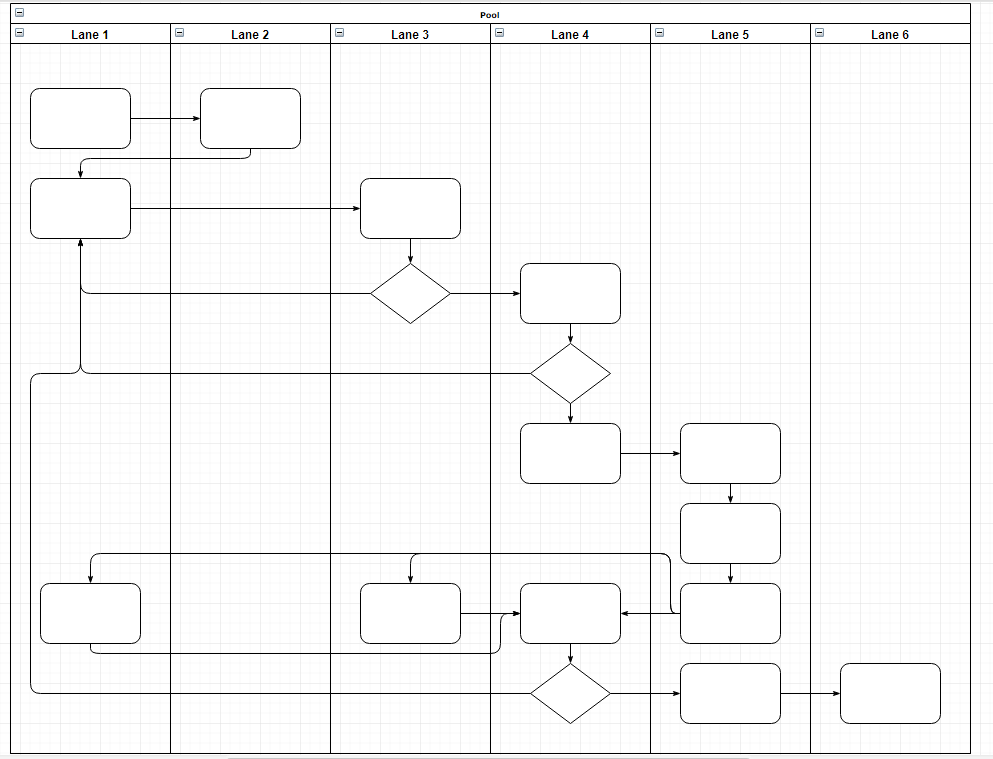
Each department or team gets its own lane. You can use as many lanes as needed to show your process. You can create loops, “if … then” branches, or “or” lanes for different outcomes.
Why does this matter more now than ever? Because today’s AI agents have all the reasoning horsepower they need but no process road to drive on. And nobody’s building the workflows they need to follow. Process quality is performance. If your handoffs are broken before you automate, automation just breaks them faster. Swim lane diagrams force you to define the process before you throw technology at it.
These diagrams also make it easier for departments to work together. They don’t just identify bottlenecks. They show objectives, capacity limits, and where teams bump into each other. When department A can see what department B is doing, you avoid collisions and duplicated work. Common uses include:
- Product development
- Marketing campaigns
- Supply chain management
- Any cross-functional process with multiple handoff points
Why use swim lane diagrams
Will swim lanes fix everything? No. There are real, practical benefits to using swim lane diagrams. Here are five that apply across most business models.
Clarifying complex processes
Processes get messy. Written explanations become dense. Verbal handoffs get lost. This drives me crazy about how most teams operate. They’re running critical work on tribal knowledge and hope.
Swim lane diagrams cut through that mess by visualizing everything. Through correct process mapping, you can clarify which entities are involved, their objectives, and who interacts with whom at every stage. Specifically, they organize:
- Redundancies - duplicated effort that nobody noticed
- Relationships between entities, their steps, and outcomes
- Responsibilities, duties, and expected results for each role
- Bottlenecks and inefficiencies, showing exactly where a process gets stuck
The visual nature of swim lanes makes it hard to ignore these issues. Redundancies and wasted effort become obvious. They stop being hidden problems and start being discussion points. That is exactly how continuous process improvement works.
Better communication and understanding
When someone reads through a swim lane diagram to understand their duties, they also see what everyone else does. That’s not accidental. It’s the whole point.
These diagrams show how departments communicate with each other. They give you a picture of the internal work environment. Say your IT department connects to every other team. If IT hits a bottleneck, it’ll ripple through the entire organization. With clear swim lanes, you can anticipate that and act before it spreads.
This saves resources and keeps your people from going crazy trying to figure out who to talk to. Swim lane diagrams answer three questions that come up constantly:
- “What now?”
- “Who’s next?”
- “Is this the expected result?”
Identifying participants and sequences
A swim lane diagram typically includes 4 to 12 entities: departments, teams, sub-groups, or specific individuals. The visual chart makes it easy to spot every participant and their sequence in the process.
You can also go deeper. Identify specific employees responsible for particular steps, flag what skills are needed (and which aren’t), and find unnecessary roles. Those extra people and unused skills? They might be put to better use somewhere else. This is often overlooked, and it’s one of the most practical outputs of the exercise.
Flexibility in how you view the process
One advantage of swim lane diagrams is their flexibility. You can map complex processes that include external sources, data inputs, symbols, and decision points alongside the standard start/end/repeat markers.
Swim lanes can run vertically or horizontally. Row sequences can hold information horizontally while roles sit in vertical columns, or flip it around. Doesn’t matter. The structure adapts to whatever makes the process clearest for the audience reading it. Different perspectives, different emphasis. Same underlying process.
Continuous improvement through analysis
Since swim lane diagrams give you a detailed view of a business process, they’re useful for spotting errors before the process completes. Which saves a lot of headaches. Based on hundreds of implementations, we’ve seen teams catch problems like:
- Missed steps
- Duplicated work
- Poor time management
- Wasted effort
- “No value” roles that exist because nobody questioned them
By recognizing these issues, you can identify areas that need fixing. Map out the problems, replace broken steps with better ones, and start eliminating the waste. That’s how you turn a static diagram into an active improvement tool.
Are swim lanes enough
What busywork costs your company
per week
per year
over 5 years
How to create a swim lane diagram
So how do you actually build one? Let’s walk through what to include and how to put it together.
Choosing which entities to include
Before you start drawing, decide which entities belong in the diagram. These can be departments, teams, sub-groups, focus groups, offices, or even individual people. It could be something bigger — a plant, a subsidiary, a partner organization. Any entity that takes part in the process can get its own lane.
The important thing is picking the right entities. Make sure every participant in the process is represented, but don’t go overboard. Usually the sweet spot is between 4 and 12 lanes. Fewer makes the swim lane pointless. More creates chaos that nobody can parse.
Five steps to get started
Step 1 — Define the purpose. Decide what outcome you want from the flowchart and what results you expect from the actions you’re mapping.
Step 2 — Pick a starting point. Choose where the process kicks off. Usually a high-level decision, often from leadership, though it depends on the goal and org hierarchy.
Step 3 — Select participants. Pick the entities for each lane. It’s critical not to have too many or too few. This decision works best when made by a group of people involved in the process rather than one person guessing.
Step 4 — Define the actions. Know which actions are necessary for the process. Too many tasks waste time and effort. Too few? You’ll get incomplete results, if you get results at all.
Step 5 — Set the order. This sounds simple but it’s the most essential step. The right sequence of actions determines whether you reach your goal. The order is usually chronological, but swim lanes can get complicated — outcomes may vary by department, loops may appear, and unexpected branches can emerge. You need to understand the complexity of your process and map accordingly.
Here’s what those five steps produce — a purchase approval process with three lanes showing exactly who handles each step and where handoffs occur:

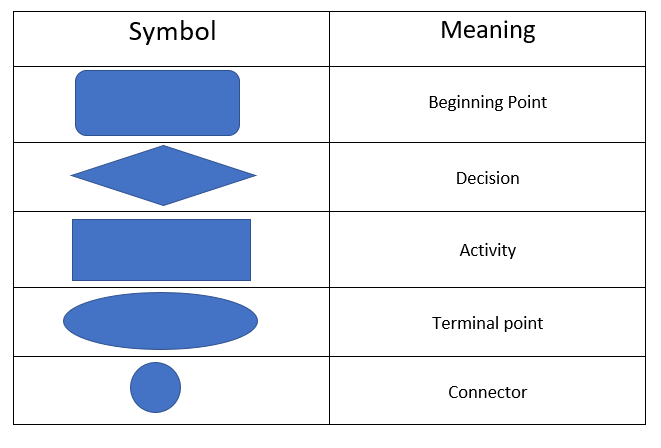
Symbols and notation
Before you draw anything, learn the standard shapes and symbols used in swim lane diagrams:
You can build swim lanes in Microsoft Word, Google Docs, or Microsoft Visio. Here’s how each works.
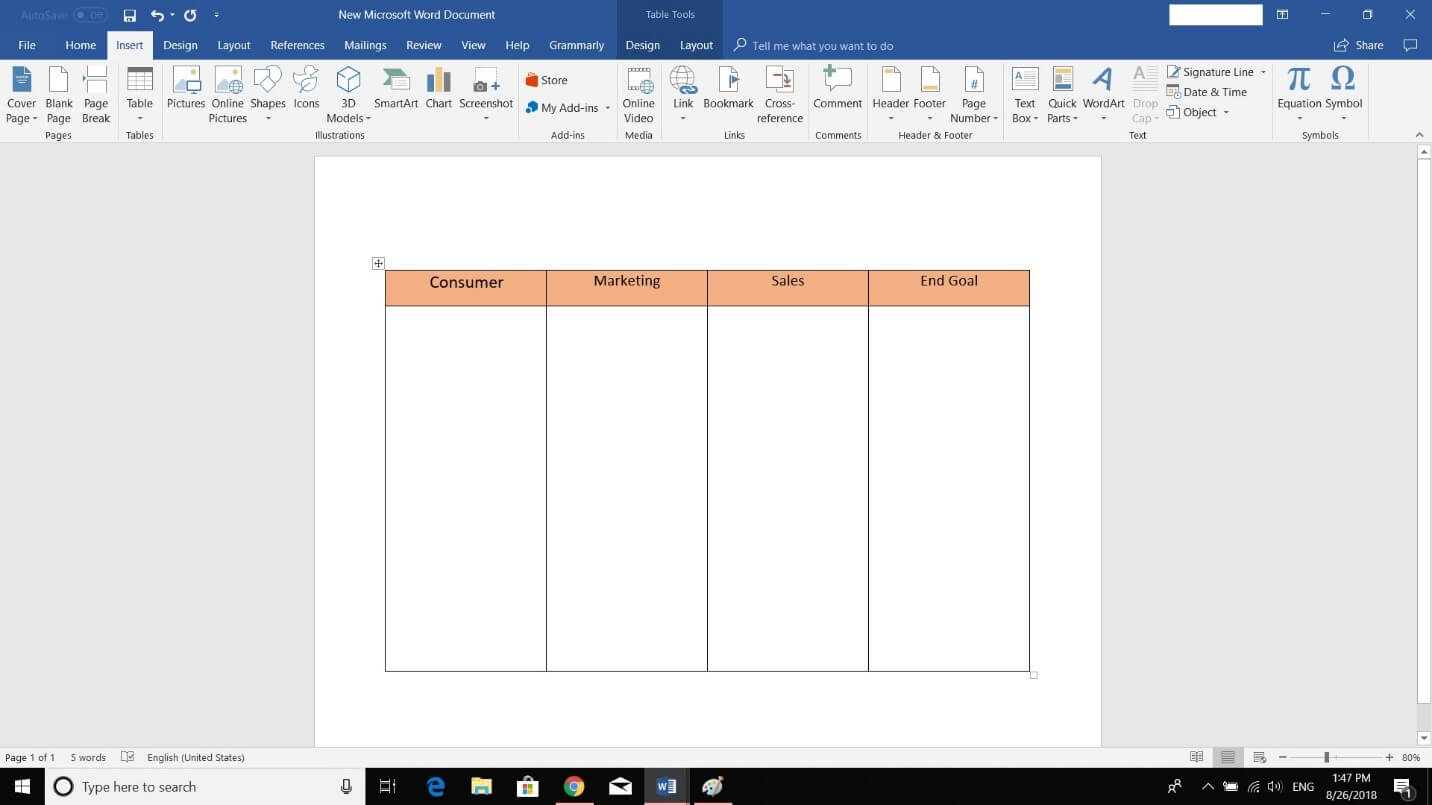
Building swim lanes in Microsoft Word
Word is mainly for text, but it can create basic swim lane diagrams. Here’s how:
Prepare a new document. Create a new Word doc and switch the page orientation to horizontal. You’ll need the extra space.
Create the swim lanes. Go to Insert > Shapes > Rectangles. Drag out a rectangle sized for all the sub-processes in that lane. Create a smaller rectangle on top for the entity label. Copy and paste for each additional lane.

Label the lanes. Use Insert > Text Box to name each lane. One downside of Word: text won’t always fit neatly inside the rectangles. The visual quality matters, and Word makes that harder than it should be.
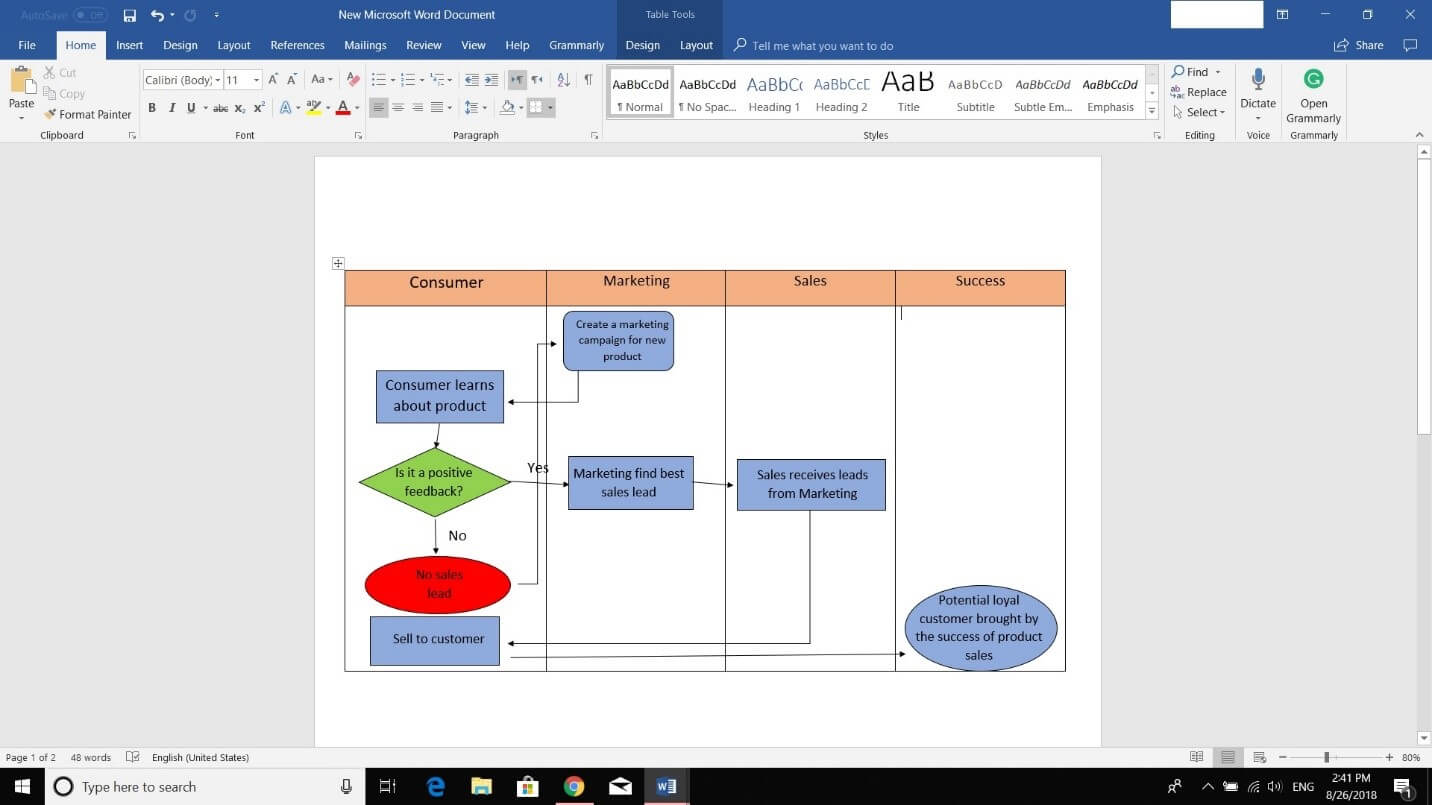
Map the process. Choose different shapes for different action types: starts, ends, decision points, and definitive actions. Connect them with lines and arrows in the right order. Add colors to differentiate meaning — different colors and arrow styles can replace a lot of text.
Building swim lanes in Microsoft Visio
Visio is built for this. Create a new document, choose Flowcharts from categories, then pick horizontal or vertical orientation. You can change the layout later from the Cross-Functional Flowchart tab.
To create swim lanes in Visio, you have several options:
- Click Cross-Functional Flowchart > Insert > Swim Lane (adds one at the end, or after the selected lane)
- Point your cursor to a lane’s top corner and click “insert swim lane shape” on the arrow that appears
- Right-click a swim lane header and choose “add swim lane before” or “after”
- Drag a swim lane shape from Cross-Functional Flowchart Shapes and drop it where you want
For labeling: click the text box shape and type your label. To move a label, go to Home > Text Block, pick a label, and drag it. To rotate a label, use Cross-Functional Flowchart > Design > Rotate Lane Label.
Problems with swim lane diagrams
Here’s where it gets interesting. Swim lanes aren’t perfect. Not even close.
Insufficient detail. Swim lane diagrams are limited to a one-page process. Details get compressed. Some get cut. You can work around this with detailed memos for each entity, but it’s a patch, not a fix. I recall a discussion with an operations manager at a mid-size logistics company who summarized the core problem: “I have a particular pain with flowcharts and nobody following them.” The diagram looked beautiful on paper, but in reality people ignored it because it lived in a binder somewhere — this pattern drove every design decision in Tallyfy, to be a living workflow, not a static picture.
No real-time communication. Swim lanes show the structure, but they don’t enable communication between entities, which leads to miscommunication and gaps that you can address with workflow software or BPM software, but the diagram alone won’t cut it.
Accessibility issues across levels. Swim lane diagrams are usually built by senior people using executive terminology, and lower-level employees — the ones who actually do the work — often can’t understand them. The fix? Involve department heads who know their team’s vocabulary.
Ignores org structure. Every organization has its own hierarchy that workflows follow. Swim lane diagrams tend to bulldoze that structure and create their own, which fits the project but confuses everyone else.
Lacks depth. Swim lanes are two-dimensional. They can’t fully represent all five organizational levels — system, process, enterprise, tasks, and knowledge. They mostly focus on tasks and processes, usually ignoring knowledge.
Swim lanes in BPMN 2.0
BPMN is a graphical notation standard for business processes. It uses flowcharting techniques similar to UML diagrams. Swim lane diagrams are a core part of BPMN 2.0 and can include all BPMN 2.0 elements.
Pools and lanes make BPMN easier for users through graphical mapping. They also help developers create more efficient diagrams through artifacts like data objects, groups, and annotations. After watching hundreds of teams try this at Tallyfy, the teams that get the most value from BPMN swim lanes are the ones who treat them as living documents rather than one-time exercises.
Making swim lanes work in practice
The swim lane diagram is one of the most useful tools in business process management. It’s an easy flowchart to map, understand, and develop. You can create one in applications you already use, like Microsoft Word, and apply it to different processes depending on your goal.
here’s the thing — a diagram sitting in a shared drive doesn’t run itself. In our experience, the gap between “we mapped it” and “people follow it” is where most teams fall apart. So if your swim lanes reveal broken handoffs, fix those first. Then think about automation.
Your organization will run smoother once you can define who does what and in what order. Tallyfy turns those swim lane concepts into trackable, executable workflows that people actually follow — not diagrams they forget about.
