Business process improvement tools that work
Process improvement tools like PDCA and the 5 Whys help you find what is broken, map what exists, and fix what matters. 70% of improvement projects fail not from wrong tools but from poor follow-through.
Summary
- Broken processes waste more than you think - Wasted employee hours on pointless steps, lower productivity from manual grunt work that should be automated, and rework from avoidable mistakes all pile up quietly until someone maps it out
- AI amplifies what’s already there - good or bad - Before throwing automation or AI at a workflow, you need to understand what the workflow actually is. Process mapping and root cause analysis come first, always
- Four categories cover everything you need - Process mapping to see what exists, problem-solving to find failures, improvement methods like PDCA and DMAIC to execute changes, and automation software to eliminate the repetitive stuff. See how Tallyfy handles process improvement
- Most improvement projects fail from poor follow-through - 70% of improvement initiatives fail not because the tools are wrong, but because people pick fifteen methods and master none
Your organization probably runs dozens of processes every single day.
You follow a similar set of steps when you onboard a new employee, resolve a complaint, or build a new report. These aren’t glamorous. They’re the plumbing of your business. And when the plumbing breaks, everything floods.
Business process improvement tools give you a way to figure out where the leaks are.
Inefficient processes are quietly destructive. They lead to:
- Wasted employee time - some steps in a process turn out to be completely pointless, eating hours that could go toward work that moves the needle
- Lower productivity - if your team is stuck doing things a machine could handle, morale tanks and output suffers
- Errors and rework - inefficiency breeds defects, and defects breed more inefficiency
Here’s the painful part: most teams don’t even know which of their processes are broken until something goes very wrong.
To help you actually find and fix these problems, I’ve put together a guide covering every major category of process improvement tool - what each one does, when to use it, and where most people trip up.
Tallyfy is Process Improvement Made Easy
Four categories of improvement tools
Since there are a lot of ways to improve processes, it helps to think in four buckets:
Process mapping - You can’t fix what you can’t see. These tools help you create a step-by-step visual of the process so you can spot where value gets created and where it gets destroyed.
Problem-solving - When something breaks, these tools help you figure out “why?” instead of just patching the symptom and hoping it holds.
Improvement methods - Diagrams are the easy part. These methods - PDCA, DMAIC, and others - give you a structure for actually making changes stick.
Automation software - Sometimes the best improvement is removing humans from steps they shouldn’t be doing in the first place. The right software handles the repetitive work so people can focus on judgment calls.
If you want to get serious about process improvement, you’ll need at least one tool from each category. But here’s my honest advice: pick one from each, learn it deeply, and resist the urge to collect methods like trading cards.
And this is where the mega trend matters. AI amplifies what’s already there - good or bad. It runs your process at 10x speed, flaws included. If you automate a broken workflow with AI, you just break things faster and at higher volume. Map first. Understand second. Automate third.

Start by mapping what actually happens
Process mapping is where everything starts. You can’t improve a process unless you know what it actually looks like - not what you think it looks like, but what people are really doing day to day.
What nobody warned us about at Tallyfy is that this is where teams get the biggest “aha” moment. They map what they think happens, then observe what really happens, and the gap is always wider than expected.
There are several mapping approaches worth knowing.
Process flowcharts
The process flowchart is the most straightforward mapping tool. You draw the steps in order, connect them with arrows, and suddenly you can see the whole thing laid out.
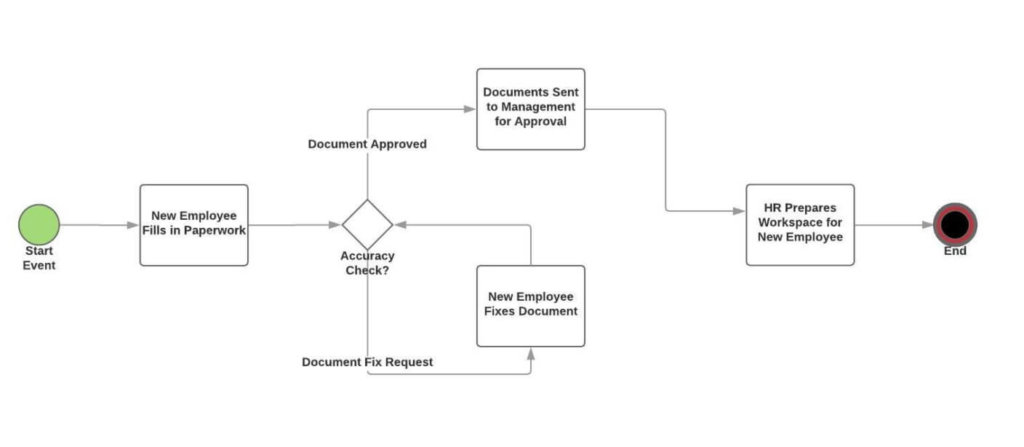
This tool helps with three things:
- Standardization - Making sure everyone carries out the best practice version of the process, not their own interpretation
- Improvement - Spotting low-value steps you can cut, or parts you can automate
- Writing SOPs - Documenting processes so new hires can learn them without shadowing someone for three weeks
You can draw a flowchart on paper or use online tools like LucidCharts.
- 3 editable documents
- 60 objects per document
- Unlimited documents
- 1 GB storage
- 3 user minimum
- Unlimited documents
- Advanced security
- Dedicated support
Turns out, online is better. You want the document accessible to everyone, not pinned to someone’s cubicle wall.
For the “how” - you can either use basic symbols (rectangles for steps, diamonds for decisions, ovals for start/end)…
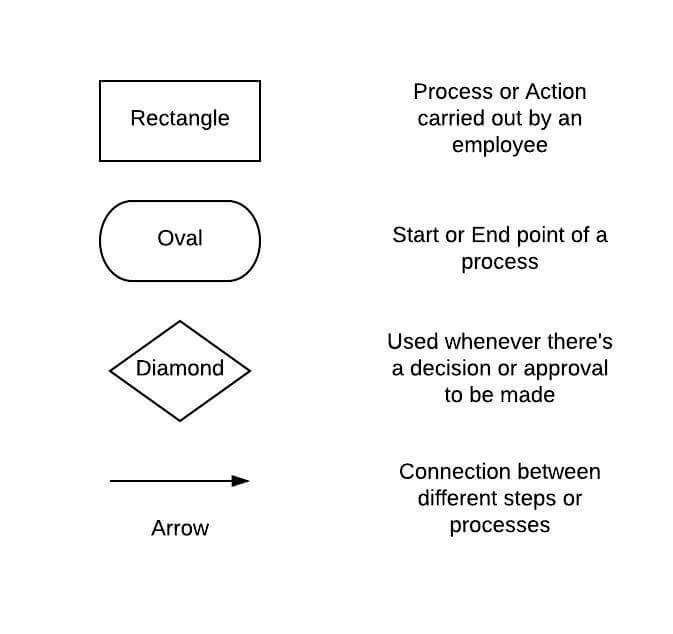
Or go with BPMN, a process mapping standard that creates a common visual language. The upside: anyone can read it - managers, team members, consultants. The downside: BPMN has a learning curve, so if you’re just starting out, keep it simple.
Want to create a process flowchart but not sure where to start? Check out our step-by-step guide.
SIPOC diagrams
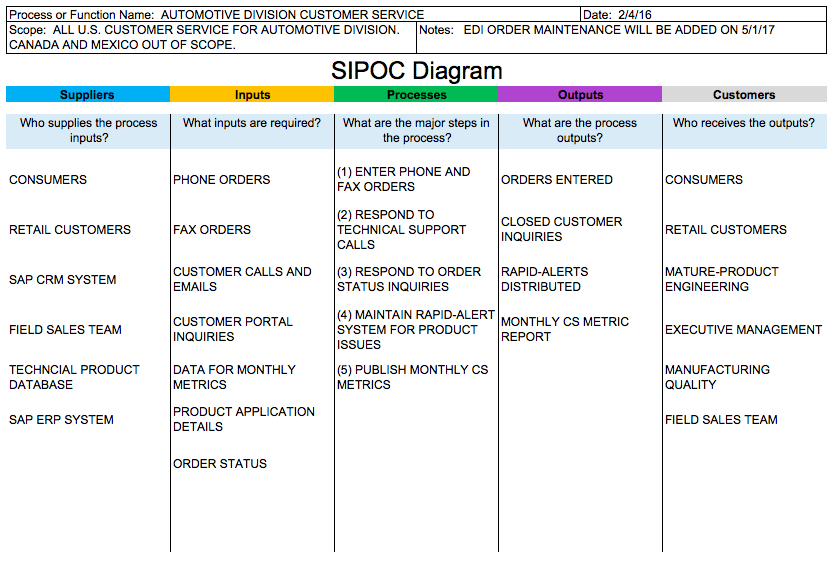
The SIPOC diagram takes a more top-down view. Where a flowchart maps individual steps, SIPOC looks at how value flows through the whole system.
It examines five aspects:
Suppliers - Who provides the inputs?
Inputs - What resources does the process need?
Processes - What are the main steps?
Outputs - What does the process produce?
Recipients - Who receives the outputs?
Based on feedback from operations teams - with manufacturing (8%) and professional services (10%) leading adoption - this end-to-end view often reveals hidden bottlenecks that step-level flowcharts miss entirely.
To create one, draw five columns titled after each aspect, then list the relevant information. Or grab a template and save yourself the formatting headache.
To learn more about the SIPOC diagram, check out our detailed guide.
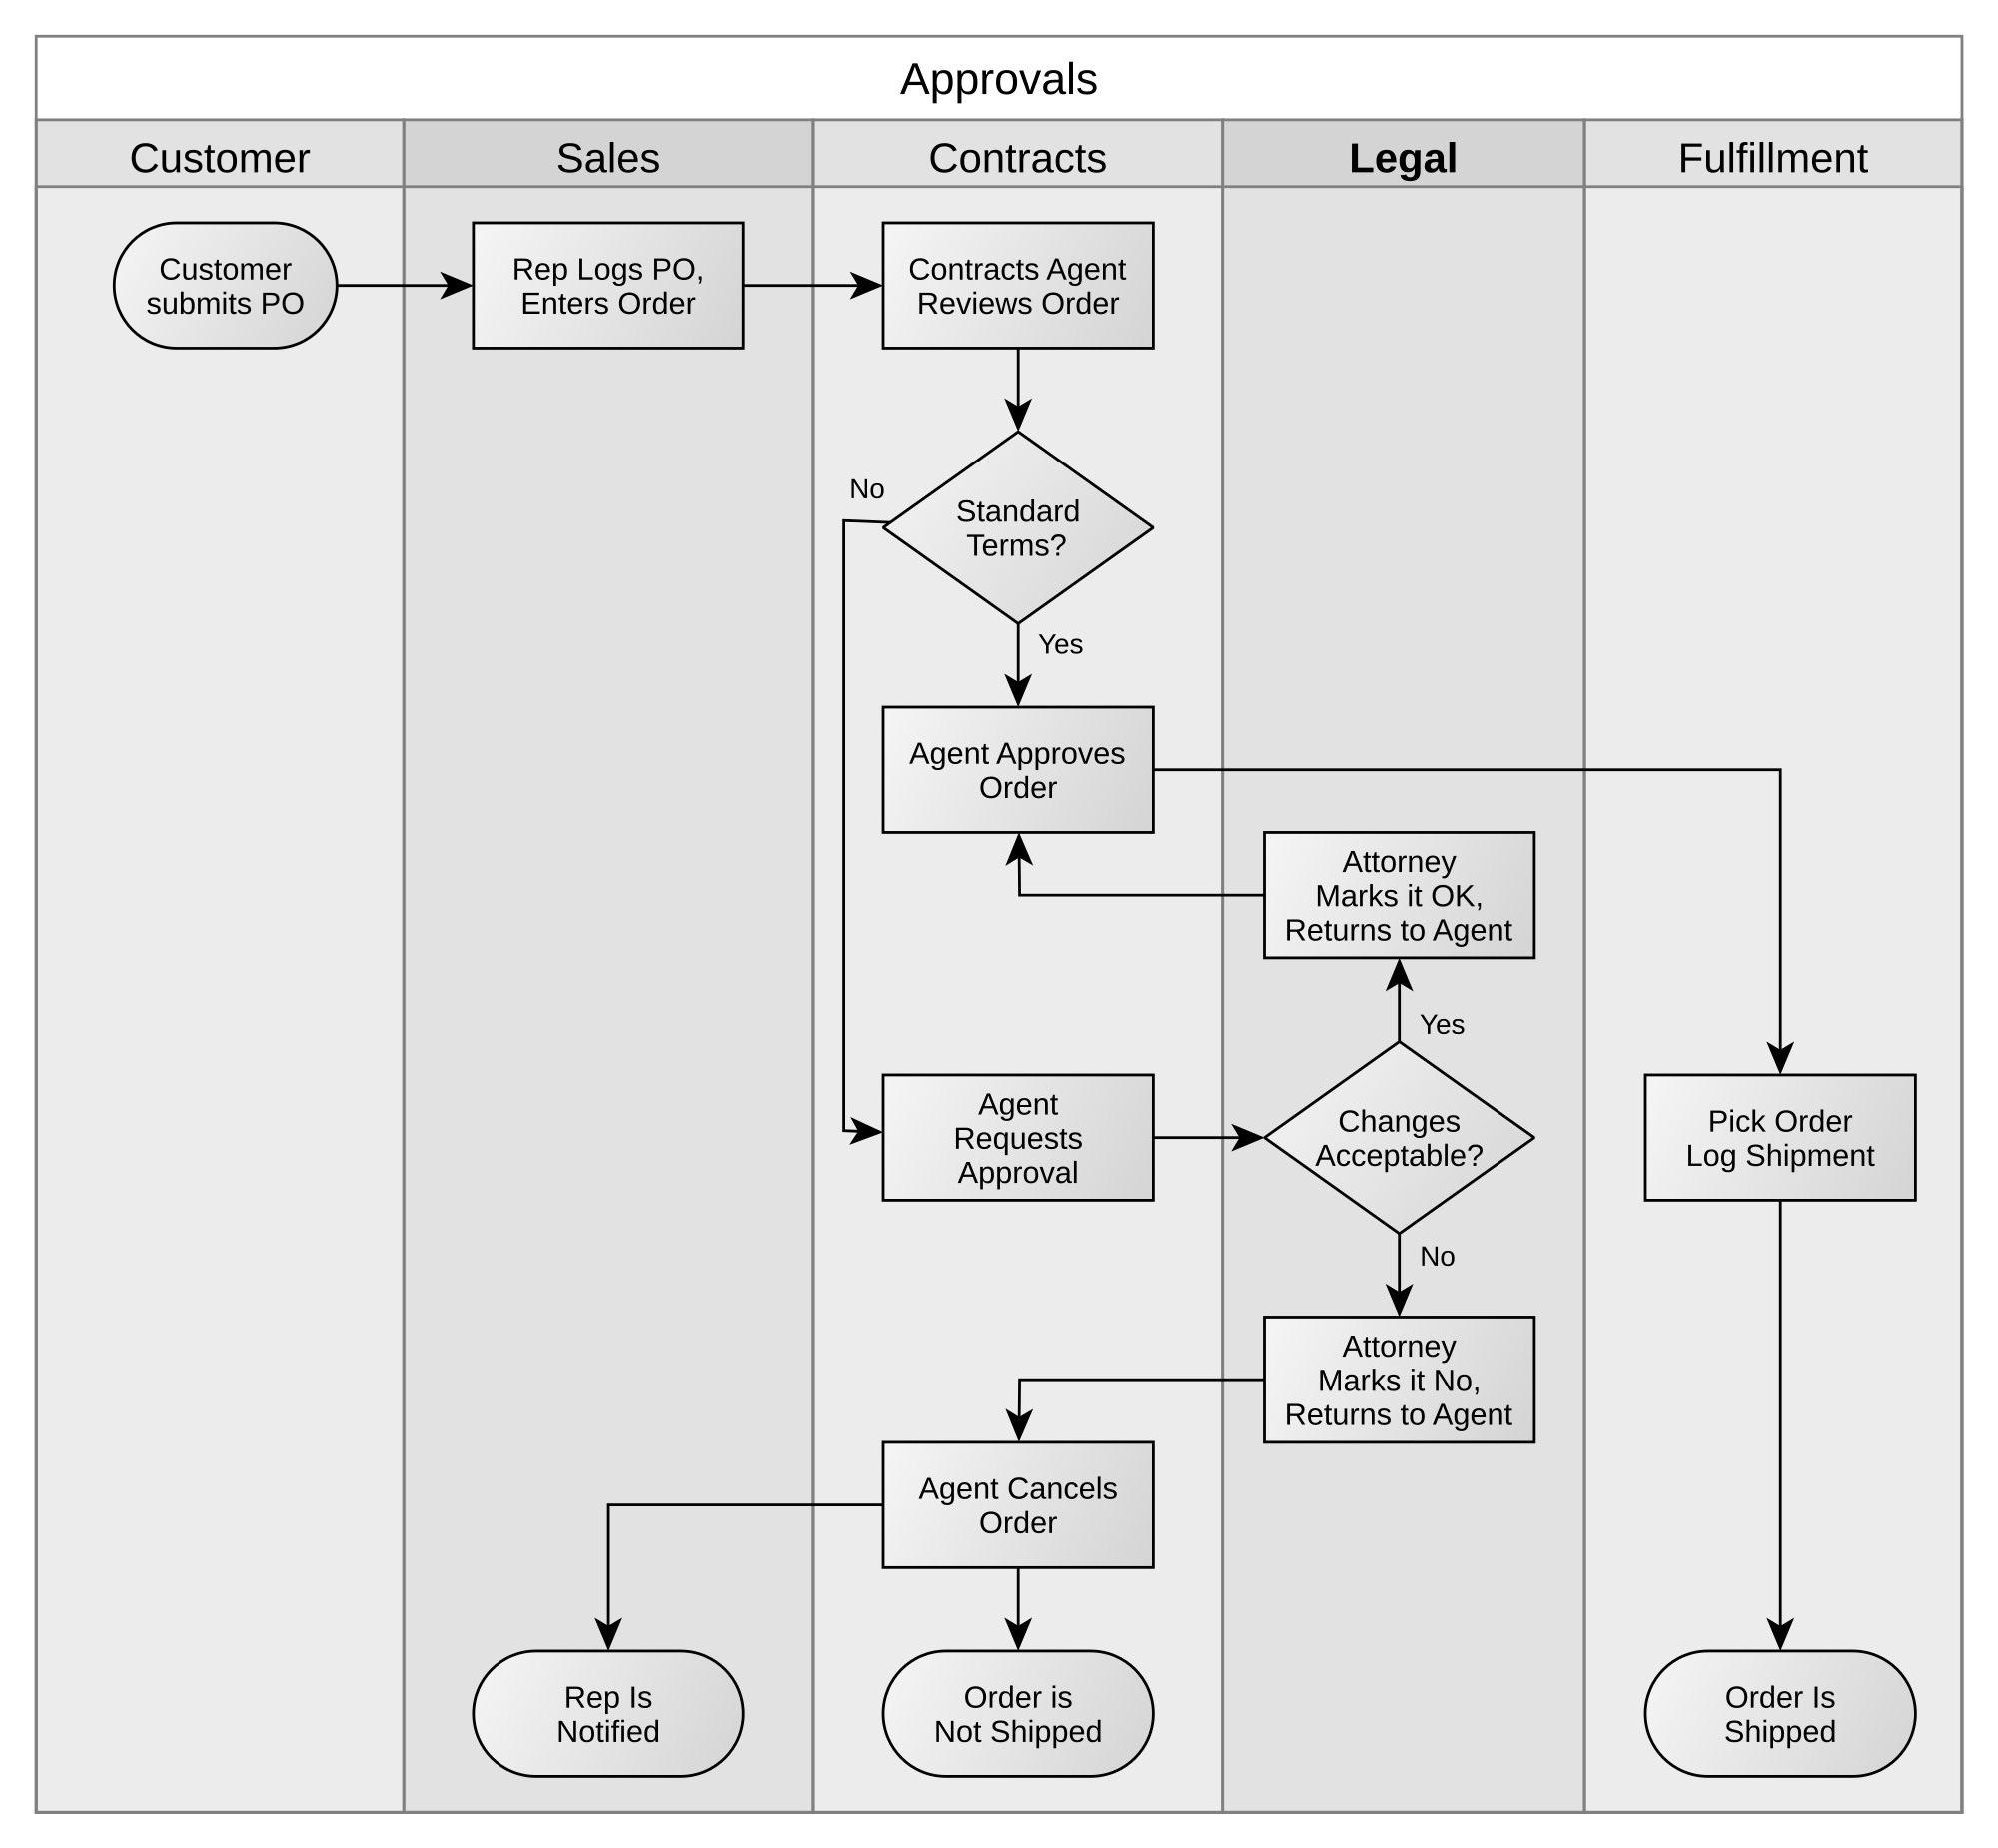
Swimlane diagrams and Kanban boards
Many processes cross departmental lines. When multiple teams are involved, even well-designed processes can fall apart because nobody’s clear on handoffs.
A swimlane diagram fixes this. You list each department (or role) across the top as vertical lanes, then map the process steps between them. The result shows exactly who’s responsible for what and where work moves between teams.
Sometimes, though, the simplest tool wins. A Kanban board - columns like “To Do,” “In Progress,” and “Done” - exposes bottlenecks you might otherwise miss. If ten tasks are stacked in “Waiting for Approval” while only two sit anywhere else, you’ve found your constraint without fancy analysis.
Kanban came from Taiichi Ohno at Toyota’s manufacturing floors, but it works just as well for knowledge work. Marketing teams, IT departments, and service groups all benefit from seeing their work laid out visually. The key is limiting work-in-progress. Don’t let any column overflow, or you’re just building a prettier version of chaos.
Problem-solving tools
Putting out fires isn’t fun. But it’s unavoidable.
Can you prevent every failure? No. “To err is human,” after all. You’re going to make mistakes. These tools help you find the root cause so the same fire doesn’t keep reigniting.
Cause and effect analysis
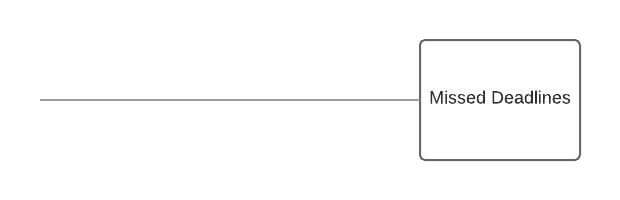
Also called the fishbone diagram, this tool helps you trace a problem back to its root.
Start by identifying the exact problem. Put it in a box on the right. Draw a horizontal line to its left - this is the “spine.”
Say your software dev team keeps missing deadlines.
Along the spine, branch out into categories that might be contributing: employees (skill gaps?), communication (broken handoffs?), stakeholders (unrealistic demands?), finances (underfunded?).
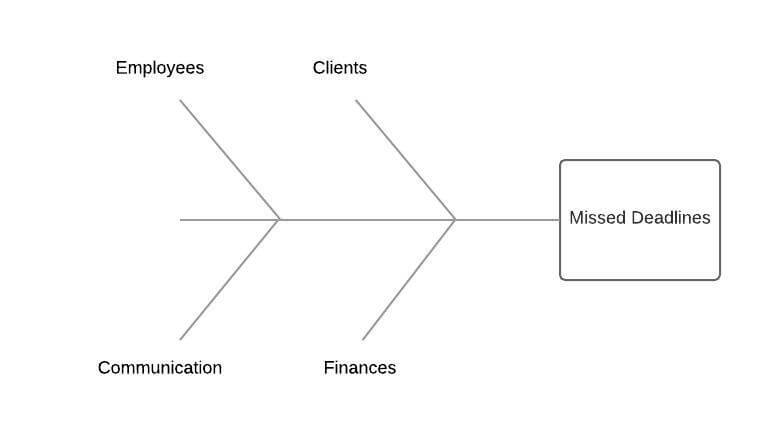
Then for each branch, brainstorm specific causes until you’ve exhausted every idea…
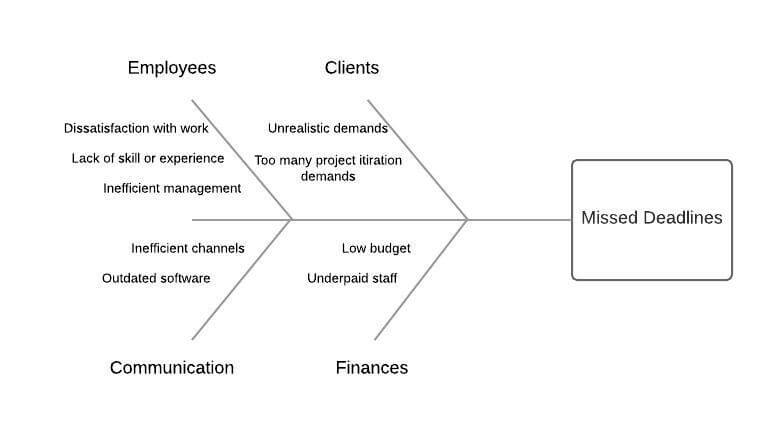
At this point, you’ve got a list of solid leads to investigate. One of them will turn out to be the actual root cause.
Want to learn more about the fishbone diagram? We’ve got a detailed breakdown.
The 5 whys
This one’s deceptively simple. You keep asking “why” until you hit the root cause. Usually takes about five rounds - hence the name.
Here’s Toyota’s classic example (Sakichi Toyoda developed this technique):
- Why did the robot stop? The circuit overloaded, blowing a fuse.
- Why did the circuit overload? Insufficient lubrication caused the bearings to lock up.
- Why was lubrication insufficient? The oil pump wasn’t circulating enough oil.
- Why wasn’t the pump circulating enough? The intake was clogged with metal shavings.
- Why was the intake clogged? There’s no filter on the pump.
Five questions. One filter. Problem solved.
For a deeper dive into the 5 Whys, head over to our guide.
FMEA - thinking ahead instead of reacting
The tools above are reactive - something breaks, then you investigate. FMEA (Failure Mode and Effects Analysis) flips that entirely. It asks: “What could go wrong, and how bad would it be?” You walk through each process step and brainstorm potential failure points. For each one, rate three things: severity (how bad if it happens), occurrence (how likely), and detection (how easily you’d catch it before it reaches the people you serve). Multiply those three scores, and the result tells you where to focus your prevention efforts. A mistake we made early on was skipping this step entirely - and we watched teams spend months firefighting the same issues because nobody took a single day to think ahead. FMEA takes discipline when nothing is currently broken, and that’s exactly why most people skip it. But the organizations that do it spend far less time scrambling, and their processes tend to hold up much longer after each improvement cycle. It’s one of those tools that feels unnecessary right up until the moment you wish you’d used it.
Improvement methods that get results
You’ve mapped the process. Maybe you’ve identified problems. Now what?
These methods give you a structured way to plan changes, test them, and make them stick.
PDCA
The PDCA cycle was developed by Dr. William Edwards Deming in the 1950s. It’s four steps:
Plan - Figure out what change you’re making. Use a flowchart or 5 Whys to identify the improvement.
Do - Test the change at a small scale first. Before rolling it out company-wide, prove the new way actually works better.
Check - Compare results. A process that looks efficient short-term might increase defect rates long-term, putting you right back where you started.
Act - Once you’re confident the improvement holds up, scale it. But don’t stop there - PDCA is a loop, not a one-time project. Keep looking for the next improvement.
For a deeper look at PDCA, check out our guide.
DMAIC
DMAIC is a Six Sigma workhorse. It stands for Define, Measure, Analyze, Improve, and Control.
- Define - What’s the problem? How does it hurt the organization?
- Measure - How’s the process performing right now? You need this data as a baseline.
- Analyze - Where are the bottlenecks? Which steps eat too much time or too many resources?
- Improve - Put solutions into practice. Start small, just like PDCA.
- Control - Make sure people stick to the new process. This is where Tallyfy really shines - workflow management software enforces the improved process so nobody drifts back to old habits. Track performance, and if results slip, start DMAIC again.
To learn more about DMAIC, head over to our guide.
Process improvement templates you can use today
Automation software
The easiest wins in process improvement? Automation. Period. Does it solve everything? Obviously not.
By using the right software, you free up your team from grunt work nobody enjoys. This makes people happier and more productive - their time goes toward work that actually creates value.
There are two main types: task automation (Zapier) and workflow management (Tallyfy).
Task automation with Zapier
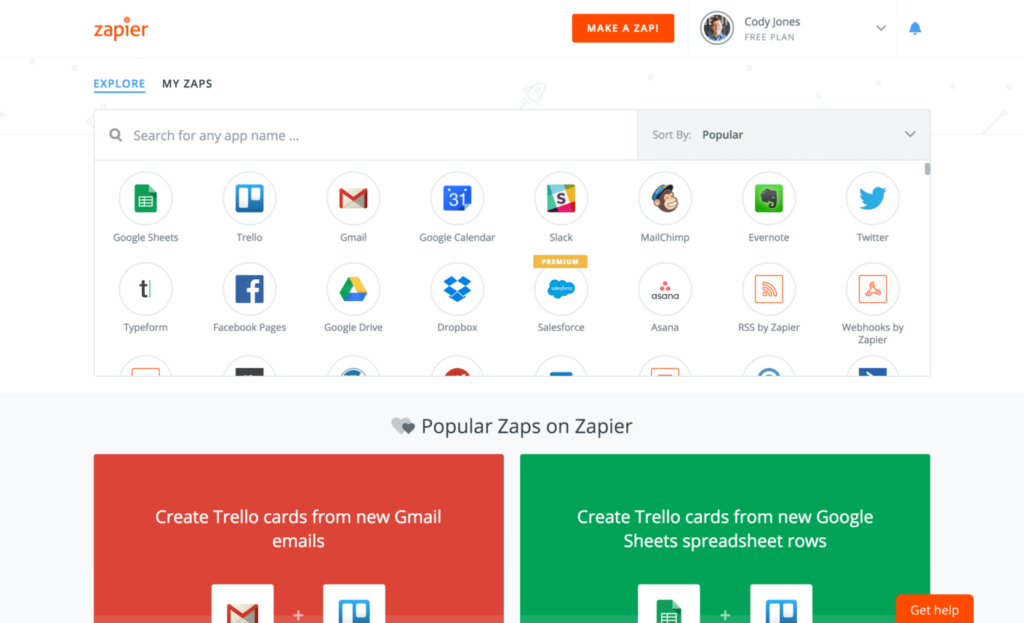
Zapier connects tools together so data flows automatically. It integrates with most third-party apps - Google Suite, Slack, CRMs, you name it.
- 100 tasks/month
- 2-step Zaps only
- 750 tasks/month
- Multi-step Zaps
- 2,000 tasks/month
- Shared workspaces
- SSO
- Custom tasks
- Governance tools
Say you have a signup form that sends emails to MailChimp. You also want the same data in your CRM so someone can follow up individually. Instead of copy-pasting, Zapier moves the data automatically.
For a full list of Zapier integrations, check their website.
To get the most out of task automation tools, combine them with workflow management software. The difference matters.
Workflow management with Tallyfy
Here’s a messy problem I think about a lot: you can’t keep track of everyone’s work just by asking around.
Are people following the best practice, or their own version of it? How do you make sure they stick to the improvements you’ve made without micromanaging?
The counterintuitive part is that operations teams already know what to fix - their number one frustration isn’t identifying problems. They spend weeks improving a process, roll it out, and within a month people drift back to whatever felt comfortable. Spreadsheets and email chains can’t prevent that drift.
Workflow management software fixes this by enforcing the process. The system tells each person what they need to do next, flags when something’s overdue, and automatically gives everyone the updated version when you make changes. No manual announcements. No “did you see the new SOP?” emails.
New to process management? Learn everything about workflow software in our guide. Or compare some of the best workflow management tools on the market.
Stop collecting methods you never master
Knowing which tools to use is only half the battle.
After all, 70% of improvement initiatives fail. In discussions we’ve had about this, the same culprits keep surfacing: poor communication and zero follow-through. Same story, every single time.
One trap I see constantly: collecting too many tools. Honestly, just because a technique exists doesn’t mean you need it. A team that knows flowcharts and 5 Whys inside-out will outperform a team with shallow knowledge of fifteen methods. More tools don’t produce better results. Depth does.
If you need faster results, try a Rapid Improvement Event (sometimes called a Kaizen Blitz). Pull a cross-functional team together for a focused week: map the current process Monday, identify improvements by Wednesday, implement changes by Friday. It sounds aggressive, but concentrated focus often accomplishes more than months of committee meetings. Just pick a bounded problem - don’t try to redesign your entire supply chain in five days.
So to maximize your odds: arm yourself with a few good tools, master them, and use software like Tallyfy to make sure improvements actually stick instead of evaporating within a month.
Related questions
Which tool is best for process improvement?
It depends on what you’re trying to do. For understanding your current process, start with a simple flowchart. For finding root causes of failures, use the 5 Whys or a fishbone diagram. For implementing and tracking changes, workflow management software like Tallyfy keeps everyone on the same page. My advice? Don’t overthink the tool selection. Pick one mapping tool, one problem-solving tool, and one method for executing changes.
What are the two most popular improvement methods?
Lean and Six Sigma dominate. Lean focuses on cutting waste - think of it as decluttering your processes so there’s room to breathe. Actually, that oversimplifies Lean, but it captures the core idea. Six Sigma, which Bill Smith pioneered at Motorola, aims to eliminate variation and defects - more like fine-tuning an instrument until it plays exactly right. Most organizations combine them into Lean Six Sigma for both efficiency and quality.
What are common KPIs for process improvement?
The ones that matter most: cycle time (how long a process takes end to end), error rate (how often things go wrong), satisfaction scores from the people receiving the output, and cost savings. Employee productivity is a big one too. These metrics tell you whether your improvement efforts are working - or whether you’re just rearranging furniture.
Is Six Sigma a process improvement tool?
It’s more than a single tool - it’s an entire collection of techniques and strategies bundled into a methodology. Six Sigma aims to improve quality by finding and eliminating root causes of defects while reducing variation. Think of it as part detective, part quality inspector, part problem solver. The DMAIC framework covered above is one of its core components.
What are the key steps to improve any business process?
First, identify the process that needs work. Then study it - figure out what’s functioning and what isn’t. Come up with improvement ideas, test them small, measure results, and scale what works. It’s iterative. You’re never truly “done” with process improvement; you’re always looking for the next thing to tighten up.
About the Author
Amit is the CEO of Tallyfy. He is a workflow expert and specializes in process automation and the next generation of business process management in the post-flowchart age. He has decades of consulting experience in task and workflow automation, continuous improvement (all the flavors) and AI-driven workflows for small and large companies. Amit did a Computer Science degree at the University of Bath and moved from the UK to St. Louis, MO in 2014. He loves watching American robins and their nesting behaviors!
Follow Amit on his website, LinkedIn, Facebook, Reddit, X (Twitter) or YouTube.

Automate your workflows with Tallyfy
Stop chasing status updates. Track and automate your processes in one place.