Process mapping tools that work in practice
Process mapping tools create visual workflow diagrams but most teams abandon them quickly. Five tools from Draw.io to Tallyfy reviewed, plus why running processes beats static diagrams.
Process mapping tools help you visualize workflows, but a diagram that nobody looks at after Tuesday is just decoration. Here’s how Tallyfy turns static maps into living, trackable processes.
Tallyfy is the only product available that does Process Documentation and Process Tracking in one
Summary
- Five tools span free to fully automated - Draw.io is completely free, Excel does basic flowcharts, LucidChart adds templates and sharing, Visio delivers powerful Windows-only mapping, and Tallyfy goes beyond diagrams into real process execution
- Free tools work but hit walls fast - Draw.io can’t share easily without hosting your own server, Excel can’t export diagrams to images, and both force you to manually tell people when something changes
- Dedicated tools add templates and real-time collaboration - LucidChart and Visio offer BPMN2, SIPOC, and Value Stream templates with built-in storage, though Visio only runs on Windows and costs more
- Tallyfy runs your processes instead of just drawing them - Rather than creating a static diagram, it assigns tasks automatically, tracks progress in real time, and updates instantly when you change something. Want to see it in action?
Why most process maps end up gathering dust
I’m going to be honest about something. Most process maps basically die within a week of being created.
Someone spends hours making a beautiful flowchart. They share it around. People nod. And then the diagram sits untouched in a folder while the actual process keeps running on muscle memory, Slack messages, and crossed fingers. That’s the dirty secret of process mapping - the map isn’t the hard part, keeping it alive is. If you want your business to run efficiently, you need to constantly analyze and improve your processes. But before you can do that, you need a clear picture of how work flows through your organization. A process map - basically a visual diagram showing each step - gives you that picture. The question is which tool you pick, and whether that tool can do anything beyond producing a pretty picture. Running Tallyfy taught us that most teams don’t need better diagrams - they need diagrams that turn into real, trackable work.
AI agents are getting smarter, but the workflows they need haven’t been built yet. That disconnect matters because an AI agent without a defined workflow is just an expensive chatbot. The tools below range from simple diagramming apps to platforms that bridge that gap.

Five process mapping tools worth knowing
Drawing processes by hand with pen and paper used to be the only option. From what I’ve seen working with organizations on process documentation - one of the top three topics in discussions we’ve had - paper just doesn’t cut it anymore.
You want to share the map with your team. You want to update it without reprinting and redistributing. You want something digital that people can reference without digging through filing cabinets.
Here’s what’s out there.
Draw.io
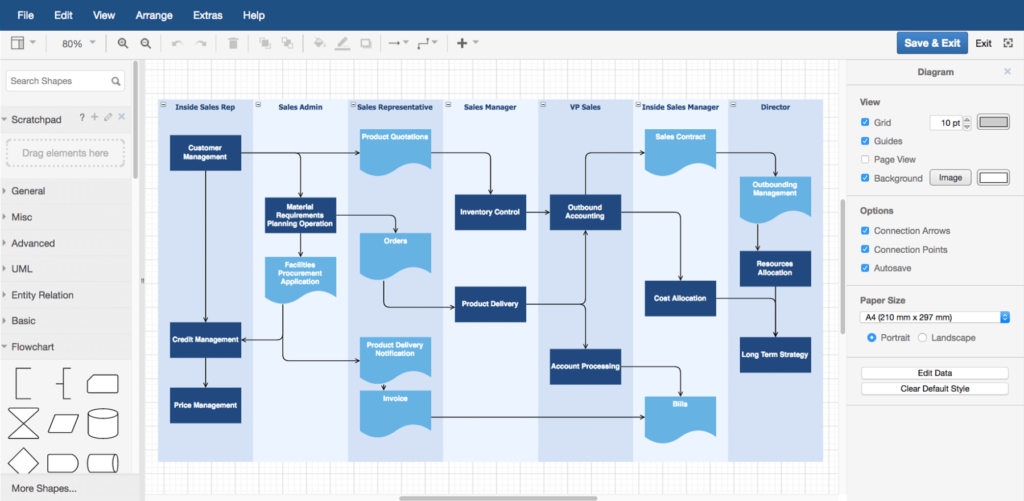
One of the simplest process mapping tools around is draw.io. In conversations we’ve had with teams, we often hear from people looking for a program to convert flowcharts into SOPs - draw.io can create the diagram, but you’ll need extra tools to turn that into something executable.
It isn’t dedicated to process mapping specifically, but it handles diagrams of all kinds. You can build anything from a simple process flowchart to a more detailed SIPOC diagram.
The best part? It’s completely free. No paywall. No trial that expires after 14 days. Just open it and start drawing.
Pros:
- Dead simple to use
- Free for personal and business use
- Integrates with Confluence and Google Drive
Cons:
- Sharing is clunky - you’ll need an internal server or cloud storage workaround
- Not built specifically for process mapping, so it lacks specialized features the other tools here offer
Microsoft Excel
You already know Excel. What you might not know is that Excel comes with charting tools that can produce basic process maps.
If you’ve bought any Microsoft product recently, you probably already have access. That’s a no-brainer - zero new software to buy, zero new logins to manage, and your team already knows how to use it.
Pros:
- You probably already own it
- Easy to create basic flowcharts
- No training needed - your team can start immediately
Cons:
- Limited to very basic process maps - anything complex gets messy fast
- Can’t export maps as images, so you’re stuck sharing the entire Excel file
LucidChart

Unlike the tools above, LucidChart was built specifically for diagramming. That means it comes loaded with features the others simply don’t have.
Templates for everything - BPMN2, SIPOC, Value Stream mapping, you name it. Built-in sharing so you don’t need to set up your own server. Multiple export formats including JPEG, PDF, and PNG.
Pricing runs from $5 to $20 per month depending on the plan.
Pros:
- Tons of process map templates ready to go
- Extremely intuitive, even without training
- Built-in storage and sharing
- Multiple export options
Cons:
- Gets expensive for larger teams - $20/month base plus $7 for each additional user
Microsoft Visio
While Excel is a spreadsheet that can draw shapes, Visio is Microsoft’s dedicated diagramming tool. It’s genuinely powerful for complex process mapping.
The price ranges from $5 to $15 per user per month, which makes it pricier than most alternatives on this list. That adds up fast.
Pros:
- Very powerful mapping features
- Extensive template library
- OneDrive integration for easy sharing
Cons:
- Windows only - if you’re on Mac, you’re out of luck
- More expensive than most alternatives
- No mobile support
Tallyfy
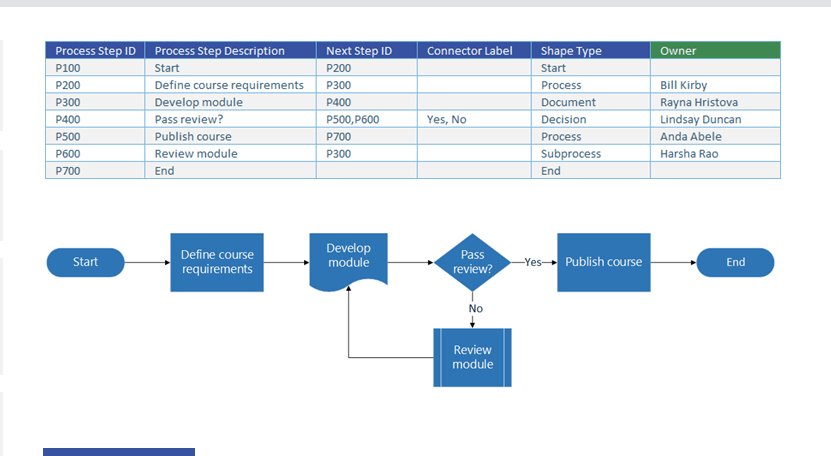
Here’s a real example of an onboarding process template:
Tallyfy isn’t a process mapping tool. It’s something different entirely. Instead of drawing a diagram of your process, you build the actual digital process. Then it runs itself.
When employee #1 finishes their task, employee #2 gets assigned the next one automatically. Deadlines are tracked. Progress is visible. Nobody needs to chase anyone down in Slack asking “did you finish that thing?”
Turns out, this is where AI infrastructure starts to matter. AI agents need structured workflows - sequential steps, parallel branches, evaluation loops - to do anything useful. A static diagram can’t give them that. A living process in Tallyfy can.
I learned this the hard way at Tallyfy. Teams across financial services (17%), healthcare (11%), and professional services (10%) discover that the real value isn’t in drawing workflows. It’s in running them.
Pros:
- Real-time process tracking - know where every process stands right now
- Automatic task assignment - the process runs without manual coordination
- File and document storage built in
Cons:
- Not designed for creating standalone diagrams
- Requires team adoption to work well
Want to learn more about workflow management systems and how they can help with process improvement? Check out our full guide.
Gap between mapping and doing
Honestly, here’s where I think most people get stuck. They treat process mapping as the goal. It isn’t. Actually, that needs more nuance.
Process mapping is a step inside Business Process Management (BPM) - a method for constantly re-evaluating and improving how work gets done. The map is useful, sure. But a map without action is just wall art.
Think about it this way. You wouldn’t hang a blueprint on the wall and call the house built. So why do teams create process diagrams and then act surprised when nothing improves?
If your process is broken and you automate it, you’ll just break things faster and at higher volume. That’s why defining and mapping your processes properly is a prerequisite - not an optional extra - for any AI or automation project.
Are your maps actionable?
Are you hearing this at work? That's busywork
Enter between 1 and 150,000
Enter between 0.5 and 40
Enter between $10 and $1,000
Based on $30/hr x 4 hrs/wk
Your loss and waste is:
every week
What you are losing
Cash burned on busywork
per week in wasted wages
What you could have gained
160 extra hours could create:
per week in real and compounding value
Total cumulative impact over time (real cost + missed opportunities)
You are bleeding cash, annoying every employee and killing dreams.
It's a no brainer - improve your workflows
How to pick the right tool
Is there one perfect tool? Not even close. The choice depends on what you’re trying to accomplish. If you just need a quick diagram for a meeting, Draw.io or Excel will do fine. If you need professional-grade diagrams with collaboration features, LucidChart or Visio make more sense.
But if you’re tired of creating diagrams that nobody looks at - if you want your processes to actually run, with tasks assigned, deadlines tracked, and progress visible to everyone - that’s a fundamentally different problem. And it needs a fundamentally different tool.
I’m biased, obviously. But I built Tallyfy because I got frustrated watching organizations pour effort into beautiful process maps that changed nothing. The goal was never to draw better diagrams. It was to make processes that run themselves.
Related questions
What is a process map tool?
A process map tool is software that lets you draw the steps in a workflow visually, like a digital whiteboard for flowcharts. Think of it as a way to turn complex business processes into simple diagrams anyone can follow. Modern tools let you drag and drop shapes, connect activities, and share your maps with the team.
What’s the best process mapping tool?
It depends on what you need. For free diagramming, Draw.io is hard to beat. For professional templates and collaboration, LucidChart works well. For elaborate technical drawings, Visio is solid. But if you want processes that actually run - not just diagrams that sit in a folder - Tallyfy does something the others don’t.
What Microsoft program works for process mapping?
Visio is Microsoft’s dedicated process mapping tool with extensive shapes and templates. But it’s Windows-only and pricier than many alternatives. You can also use PowerPoint or Excel for basic maps, though they weren’t designed for this and lack workflow-specific features.
What are process mapping examples?
Process maps can show anything from how you handle a support ticket to how you onboard a new hire. A common one: an employee onboarding map that tracks every step from job offer to first day. Another: a complaint resolution workflow from initial report through to fix.
Process mapping examples you can use today
Is process mapping a lean tool?
Yes. Process mapping is a core lean technique because it makes invisible waste visible. When you draw out every step, you can spot delays, bottlenecks, and redundant actions that you’d never notice otherwise. That visual clarity is what helps teams simplify and eliminate waste - which is the whole point of Taiichi Ohno’s lean methodology.
How often should process maps be updated?
Every few months at minimum, or whenever something significant changes in your workflow. New technology, new regulations, new team members - any of these can make an existing map outdated. Digital tools make updates much easier than the old paper-and-pen approach. Based on feedback we’ve received from hundreds of implementations, quarterly reviews tend to work well for most teams.
What’s the difference between process mapping and workflow automation?
Process mapping draws a picture of work steps. Workflow automation executes those steps with software. Think of mapping as drawing the blueprint, and automation as building the house. Modern tools like Tallyfy do both - you map out your processes and then convert them into automated workflows that assign tasks, enforce deadlines, and track progress without manual intervention.
Can process mapping work for small businesses?
Absolutely. It might even be more valuable for small teams than large ones because it establishes clear procedures from the start. When everyone’s wearing multiple hats, having documented processes prevents things from falling through the cracks. Digital process mapping tools have made this accessible and affordable for businesses of any size.
About the Author
Amit is the CEO of Tallyfy. He is a workflow expert and specializes in process automation and the next generation of business process management in the post-flowchart age. He has decades of consulting experience in task and workflow automation, continuous improvement (all the flavors) and AI-driven workflows for small and large companies. Amit did a Computer Science degree at the University of Bath and moved from the UK to St. Louis, MO in 2014. He loves watching American robins and their nesting behaviors!
Follow Amit on his website, LinkedIn, Facebook, Reddit, X (Twitter) or YouTube.

Automate your workflows with Tallyfy
Stop chasing status updates. Track and automate your processes in one place.