Summary
- Over 50% of process improvement initiatives fail - The primary reason is lack of know-how around mapping processes, analyzing problems, and implementing changes that actually stick with employees who resist breaking old habits
- Process mapping comes in three main types - Process flowcharts optimize individual steps, SIPOC diagrams analyze suppliers and customers without drilling into flow details, and value stream maps track exactly how you deliver value including duration and KPIs for each step
- Root cause tools range from simple to complete - The 5 Whys requires no data or statistical analysis (just keep asking “why” until you find the root), while DMAIC provides a full Define-Measure-Analyze-Improve-Control methodology for systematic improvement projects
- Process management software solves the enforcement problem - Rather than manually notifying employees of changes and hoping they stick to new procedures, software automatically enforces the updated process and tells workers exactly what to do at each step. See how Tallyfy improves processes
In today’s world, businesses that can innovate and improve thrive. Ones clinging to old practices, though, eventually die out.
To stay ahead of your competition, your organization should focus on continuous improvement. Meaning, you should constantly re-evaluate your business processes, find improvements, and implement them.
Unless you’re a process improvement consultant, though, this won’t be the easiest of tasks. Over 50% of process improvement initiatives fail - and that happens for a reason. That’s a rough number to sit with.
You need a lot of know-how to do this right. You need to know, for example, how to map processes, how to analyze the map, and so on.
If you have the right tools at hand, you’ll probably be dramatically increasing your chances.
To be fair, no single tool guarantees success on its own. To give you a head start, we’ve compiled a list of 6+ continuous improvement tools which are bound to sharply improve your odds.

Finding the right tool for your situation
Before we dive into the specific tools, let’s talk basics. If you already have a good basic understanding of process improvement as a methodology, jump ahead to the first tool, Drive. Otherwise, read on!
As we’ve already mentioned, continuous improvement means constantly improving your processes.
There are 2 parts to it. One is cultural - making your organization used to improvement on a general basis. Your employees should be supportive of any initiative, and should always be willing to take part.
To learn more about this part, check out our article on Kaizen, where we cover the cultural aspect of improvement more throughout.
The other part is more practical - the “hows” and “whys” of improving specific processes.
The continuous improvement tools we’ll cover in this article focus on the later part.
New to process improvement and want to learn more? Check out our complete guide to continuous improvement.
If you’re looking for software that brings these continuous improvement methodologies together in one platform, Tallyfy provides the structure to document, track, and systematically improve your processes over time.
Tallyfy is Process Improvement Made Easy
Process mapping
Process Mapping is the methodology for visualizing business processes. It’s one of the most essential continuous improvement tools.
Before you can improve a process, it’s helpful to have it down on paper. This way, you can actually see potential improvements. Is a map alone enough to fix things? No.
There are several different types of process maps, depending on what you’re working on improving…
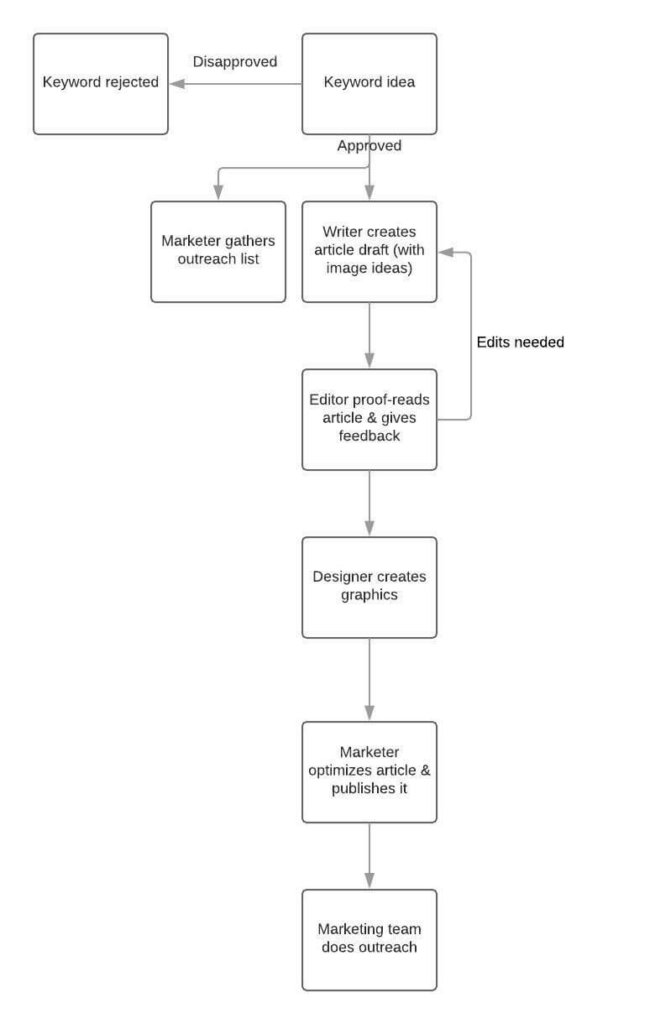
Process Flowchart - This is the most straightforward process map. You draw the business process as a flowchart, with each block being a single step. If you want to optimize the steps of the process, this map type is the go-to.
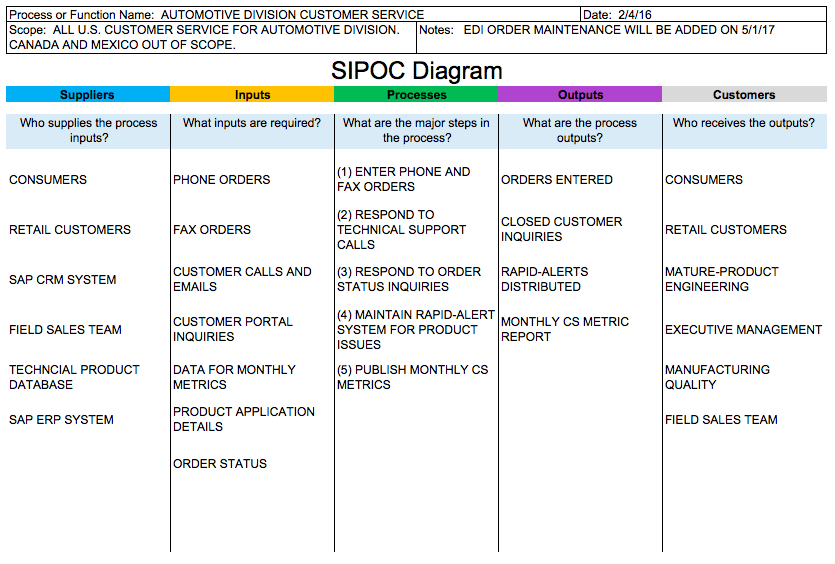
SIPOC Diagram - SIPOC stands for Supplier, Inputs, Processes, Outputs, and Customers. This is a more top-down process map, as it doesn’t go into the details of the process flow itself. Rather, you analyze all the external aspects of the process and improve on those.
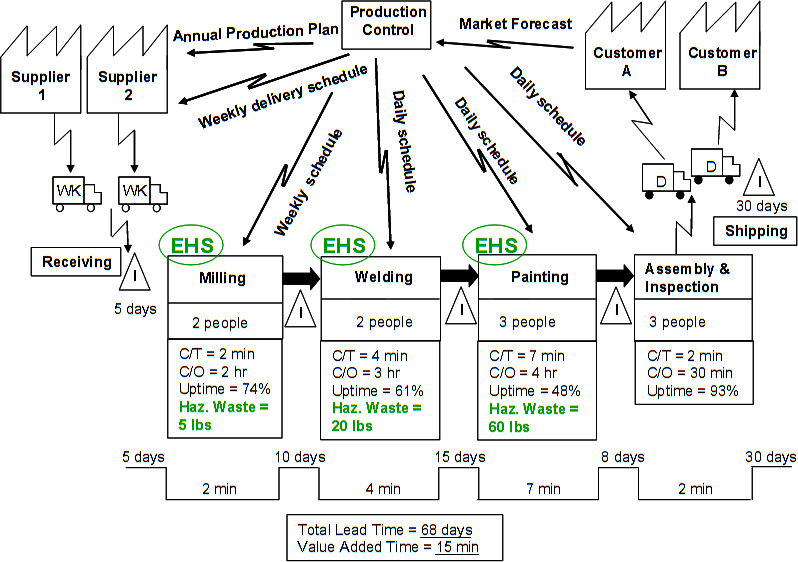
Value Stream Map - As with the SIPOC diagram, this one is top-down. The value stream map analyses the exact way you deliver value to the end-customer, including the process itself, duration of each step, KPIs, etc.
Depending on your needs, there are several other types of diagrams you could use. Check out our complete guide to process mapping to learn more.
Drive
DRIVE is a continuous improvement tool that involves evaluating problems so you can break them down into simple, actionable steps. DRIVE stands for:
- Define - Defining the problem and identifying success criteria.
- Review - Analyze the current situation, looking for areas that are problematic or need improvement.
- Identify - Finding potential solutions to the problem and evaluating the type of changes needed to sustain these improvements.
- Verify - Figure out whether or not the solutions and changes conducted will help reach the criteria of success as defined in step #1.
- Execute - Carry out the implementation of solutions or improvements. Check if your success criteria are met and review the entire process.
Root cause analysis
The Root Cause Analysis is, as evident from the name, a methodology aimed at discovering the root of any problem, issue or quality concern. It’s done in three stages…
- Open Phase - The first is the brainstorming phase. Here, the team comes up with any possible issue that might be causing the problem. The idea here is to generate as many ideas as possible (without filtering any)
- Narrow Phase - The team narrows down the possible ideas to as few as possible, proving most of the theories wrong
- Closed Phase - Once several potential issues are identified, the team validates the final short-list of problems.
Need help implementing the root cause analysis? We’ve got you covered!
The 5 Whys
The 5 whys is a theory first developed by Taiichi Ohno’s Toyota Production System and now are an important part of Lean Manufacturing, Kaizen, and Six Sigma.
The idea behind it is simple - you continue asking “why” 5 times until you discover the root of the problem. This allows you to break through the layer of symptoms and get to the root of the problem.
People commonly want to address symptoms when problems arise. Then they don’t understand why these same problems tend to keep happening. In our conversations with operations directors at midsized healthcare organizations and manufacturing firms, we’ve heard this exact frustration repeatedly - they fix the same issues quarter after quarter because nobody dug deep enough to find the actual root cause.
Using the 5 Whys may take longer initially, but it will save you the trouble of having the same problems crop up over and over again in your business.
The 5 Whys help you get to the root of any problem and understand the relationship between the different causes of this problem.
Turns out, it’s one of the easiest tools you can use because it doesn’t require any data or statistical analysis.
To give you a better idea of how this works, here is a simple example from Toyota’s website…
-
Why did the robot stop?
- The circuit has overloaded, causing a fuse to blow.
-
Why is the circuit overloaded?
- There was insufficient lubrication on the bearings, so they locked up.
-
Why was there insufficient lubrication on the bearings?
- The oil pump on the robot is not circulating sufficient oil.
-
Why is the pump not circulating sufficient oil?
- The pump intake is clogged with metal shavings.
-
Why is the intake clogged with metal shavings?
- Because there is no filter on the pump.
Want to learn more? We’ve got a dedicated guide for conducting the 5 Whys Analysis!
Plan-Do-Study-Act (PDSA) cycle
The PDSA cycle is a continuous improvement tool developed by W. Edwards Deming. It consists of four phases…
- Plan - Identifying potential problems and shortcomings within the company, be it about a process, product or service.
- Do - The planned changes are carried out on a small scale. This acts as a test on whether the proposed changes work or not, without having to risk implementing it on a larger scale.
- Study - Once you’ve got some data on how well the new process works, it’s time to benchmark it to the original. If it doesn’t work as planned, then all the new information is taken into consideration when starting the cycle anew. If it does, then you proceed to the final step.
- Act - Having confirmation that the new process is better than the old one, you can finally start executing it on a company-wide scale.
DMAIC
DMAIC is a bit similar to drive, and it stands for: Define, Measure, Analyze, Improve and Control.
- Define - The first phase is identifying all the strategic aspects of the entire procedure. That’s articulating the problem, defining the budget or the scope of the project, etc.
- Measure - Here, the benchmark for improvement has to be identified. i.e, once the process improvement initiative is carried out, the new data should be compared with the old, identifying which method or process is better.
- Analyze - During the analyzing stage, the team has to identify the root cause of the problem. This can be done with a root cause analysis (Fishbone diagram, for example). Once about 3 or 4 potential causes are identified, their connection to the original metric is to be determined.
- Improve - Once the root cause is found, different solutions are to be tested (usually on a smaller scale). If the solution does solve the problem, and it is empirically proven with data vs the “measure” step, it can be scaled and applied to all relevant processes.
- Control - The DMAIC process improvement initiative doesn’t end with implementing the right changes. Once that’s done, it’s important to keep track of the improved process, making sure that it is working as intended.
Templates that support continuous improvement
Modern additions: Kanban and rapid improvement events
Here is something the traditional continuous improvement playbook often misses: you don’t need a three-month project to make real changes. Rapid improvement events (sometimes called kaizen blitzes) compress weeks of analysis and implementation into a focused few days. You pull together a cross-functional team, lock them in a room with the problem, and walk out with actual changes deployed - not a report that sits on a shelf. We’ve seen operations teams at distribution companies knock out bottlenecks in their order fulfillment process during a single focused week that would have taken months through normal channels.
The other shift worth noting is how visual work management has become table stakes. Kanban boards - whether physical sticky notes on a wall or digital versions - give everyone instant visibility into where work actually stands. No more status update meetings where half the room zones out. When you can see that six tasks are piled up waiting for the same approval, the problem becomes impossible to ignore. This kind of transparency creates its own pressure for improvement. Teams start experimenting with small changes because the feedback is immediate - you tweak something on Monday and see whether it cleared the backlog by Wednesday. That tight feedback loop is what makes improvement stick, not annual process audits that nobody remembers by Q2.
Why process management software changes the game
There are a lot of problems with process improvement, but one of the most painful ones is enforcement. You spend countless hours improving a process, but your employees just won’t stick with the new variation. Old habits die hard. Will a single email fix this? No. In most cases, this is usually because of habit - the employees are used to doing things one way, and then you expect them to change their behavior. Some will stick, others will take a while. Every time we onboard a new team, the same issue surfaces. The rollout email goes out, a few people adopt the new steps, and everyone else quietly goes back to what they were doing before. The gap between “announced” and “adopted” can feel enormous, especially when you don’t have a way to enforce the new process at every step. I learned this the hard way at Tallyfy - the gap between announcing a process change and actually seeing it adopted can stretch for months when you rely on manual enforcement alone. By using business process management software, though, you can get rid of this problem.
Instead of having to notify your employees of changes manually and keep track of whether they are sticking to it or not, you can basically just make a change to the process through software.
The employees will get a notification that the process will be carried out differently.
Then, the system will automatically enforce the changes, telling the employees exactly what they need to do for each step. The question we get asked most often by COOs at professional services firms is how to reduce the typical resistance that comes with process changes - and the answer is almost always enforcement through software. One legal services company told us they reduced a multi-week client processing stage to under a week by making the steps trackable.
Want to get started with BPM software, but not sure which provider to pick? Learn how to tell them apart with our guide to some of the best BPM tools on the market.
Related questions
What are the 5 key principles of continuous improvement
The 5 key principles of continuous improvement are simple concepts that yield real changes!
The first is to illuminate problems - much as turning on a light in a dark room allows you to see what needs cleaning. Second, listen to the ones doing the work, who often have the best ideas about how to make it work better.
Three, take small steps instead of jumping in the deep end - remember learning to walk before you learned how to run? Fourth, establish broad, easy-to-interpret indicators for success, the way you might use a map to know you’re going in the right direction.
Five, make improvement an all-the-time activity, not just the work of a separate improvement staff nor done only as a special project that comes up every so often.
What are the 4 steps of continuous improvement
There are four steps to continuous improvement based on a cycle known as PDCA: Plan, Do, Check, Act.
Consider it like trying out a new recipe. First, you decide what you’re going to make, and you collect the necessary ingredients. Next, you cook the thing.
Next, you taste and consider what sticks and what doesn’t, and what you might do better. Finally, you respond to what you’ve learned, by tailoring the recipe the next time.
Every time you do this, it’s a little bit better.
How do you start a continuous improvement program
Starting a continuous improvement program is a lot like planting a garden. Start with a portion of your home you can make over quickly.
A good place to begin is to select one process that currently drives people crazy and work at making it better. Involve everyone by asking for their input and experiences.
Establish a low-tech method for monitoring progress, such as a habit of taking regular before and after photos. Above all else, remember to celebrate small wins to keep the motivation going to make things even better.
What is the difference between continuous improvement and process improvement
Process improvement isn’t maintaining the entire city’s transportation system; it’s only fixing one road. Improving process looks at how to make one workflow better - for example, better managing customer orders.
Continuous improvement is a never-ending process that re-evaluates everything in your organization, fostering a culture in which everyone is constantly seeking ways to make things work better.
Which continuous improvement tools are best for beginners
If you’re just starting out, get tools that are simple, easy to understand and use. The 5 Whys method is akin to a young child who continues to ask, “Why?” till they uncover the cause.
Process mapping is a bit like sketching a map of how work moves through your organization. Basic checklists can ensure nothing is missed.
These are some of the simplest tools, the bicycle wheels - but “them things,” lots of folks say, “are how you learn to balance.”
How do you measure continuous improvement success
Analyzing continuous improvement success is just as fun as keeping score in a game. Watch for short-term victories and long-term progress.
Keep track of simple measures, like how much time you save people, how many mistakes you prevent, how happy people are as a consequence. Use visual graphs that anyone can tell what you’re measuring, like a weight loss chart.
Be sure you measure the hard numbers (like a decrease in errors or an increase in market share) as well as the soft benefits, such as an increase in employee satisfaction or better teamwork.
What role does technology play in continuous improvement
Technology that is constantly being refined is like a high-end pair of binoculars - it makes it easier to see and to work more effectively. Modern tools like workflow software make it possible to measure progress, flag bottlenecks and share improvements with teams.
But don’t forget: technology’s just a tool - and it’s at its strongest when used alongside human ingenuity. The trick is to strike the right balance between digital tools and human problem-solving.
How often should you review continuous improvement efforts
Monitor efforts at continuous improvement the way you monitor your garden - occasionally, but not obsessively. Quick daily checks are great for identifying issues immediately.
Weekly team meetings help keep everyone focused and energized. Monthly reviews can be used to keep up with bigger trends and milestones.
Deep dives work best on a quarterly basis. Like taking a step back and looking at the big picture. The trick is for those reviews to be useful and action-oriented, rather than just meetings for the sake of meeting.
