Six Sigma tools give you a structured way to find what’s broken in a process, measure how broken it is, and fix it so it stays fixed. That’s the short version. The long version involves control charts, fishbone diagrams, FMEA, and a belt system borrowed from martial arts. The core idea hasn’t changed since Bill Smith developed it at Motorola in the 1980s.
Summary
- Six Sigma demands near-perfection - Introduced by Motorola engineer Bill Smith in the 1980s, Six Sigma allows no more than 3.4 defects per million opportunities. At Three Sigma level, a pharmacy would have 54,000 incorrect prescriptions yearly versus three at Six Sigma level. General Electric saw $300 million increased revenue in year one
- Control charts and FMEA catch problems before they spread - Control charts plot measurements with upper and lower limits to separate normal noise from real signals. FMEA asks “what could go wrong?” systematically and scores each potential failure by severity, likelihood, and detectability
- Process stapling reveals what actually happens - Following a document or request through every real step exposes the workarounds, delays, and handoffs that never make it into formal process documentation
- Belt certifications and DMAIC methodology structure the work - The DMAIC cycle (Define, Measure, Analyze, Improve, Control) provides the roadmap, while belt levels from White to Master Black Belt certify expertise. Over 60% of projects fail without process enforcement. Need help improving processes?
Tallyfy is Process Improvement Made Easy
Quality and compliance come up in over 1,500 combined discussions we track with mid-market teams. Six Sigma tools are an essential part of any business process improvement initiative. By identifying flaws and weaknesses in your processes, they let you improve efficiency in ways that stick.
Here’s something worth thinking about, though. Six Sigma is how you define quality processes first, so that when you do layer AI or automation on top, you’re amplifying something good instead of something broken.
What is Six Sigma?

Six Sigma is a framework designed to eliminate waste and improve the experience for everyone involved: the people doing the work and the people receiving the results. Bill Smith, an engineer at Motorola, first developed the concept in the 1980s. Today, it’s the most popular quality improvement methodology in history, used worldwide across nonprofits, prisons, hospitals, banks, and corporations.
If you’re running a Six Sigma organization, then for every million opportunities there are no more than 3.4 inefficiencies. That demands results close to perfection. If a business operated at a Three Sigma level, there’d be 66,807 defects per million opportunities. To put it another way, a pharmacy at Three Sigma would have 54,000 incorrect drug prescriptions every year. At Six Sigma, that same pharmacy would have three.
The goal is to eliminate variation.
Variation tells the people you serve that you’re inconsistent and don’t deliver predictable results. And nobody wants that. Can you eliminate all variation? No.
The CTQ question nobody asks early enough
Something that trips up many teams starting Six Sigma: they jump straight into measuring everything without first asking what actually matters to the people receiving the output. In Six Sigma terminology, these are called CTQs, or Critical to Quality characteristics. Not what you think people should care about. What they actually care about.
Teams can spend months reducing defects in areas that barely get noticed and miss the one thing that would move the needle on satisfaction. CTQs force you to start from the outside perspective and work backward to your process metrics. The discipline of formally identifying CTQs before measuring anything else separates successful Six Sigma projects from wasted effort.
DMAIC methodology
Six Sigma is usually accomplished by implementing the DMAIC methodology. DMAIC stands for Define, Measure, Analyze, Improve, and Control.
- Define: Your team clearly outlines the problem, decides on a goal, and evaluates all the tools and resources available.
- Measure: Next, look more closely at the process already in place and measure its performance. Evaluating current performance gives you a better idea of what improvement is needed.
- Analyze: When your team analyzes the problem, you try to discover the root cause.
- Improve: Once the problem has been identified, your team brainstorms possible solutions and puts a plan in place.
- Control: The final step involves creating systems to control process performance. Without it, you may end up dealing with the exact same issue in six months.
Benefits of Six Sigma implementation
Organizations from nearly every industry have benefited from Six Sigma. After its first year of using Six Sigma principles, General Electric saw $300 million in increased revenue. Akron Children’s Hospital cut MRI wait times by 90 percent and reduced supply location time by 63 percent. In 2007, the United States Army saved over $2 billion by applying Six Sigma to task management and fuel recycling. Not bad for a methodology that started on a factory floor.
Belt levels and certification
Six Sigma professionals receive “belt levels” based on experience and capabilities:
- Master Black Belts: Strategize and find ways to apply Six Sigma principles across business structures, and provide training to other team members.
- Black Belts: Lead projects that provide solutions to high-level problems. Also responsible for training others.
- Green Belts: Collect data and provide analysis.
- Yellow Belts: Assist the team with process improvements.
- White Belts: Help with solving problems but aren’t necessarily part of the core team.
Six Sigma tools that help drive change
Six Sigma is a methodology that helps eliminate waste and inefficiencies within business processes. Six Sigma tools, on the other hand, are techniques that help with the analysis and improvement of those processes. Actually, that distinction is a bit too clean. If used the right way, they can help eliminate waste, increase employee productivity, and drive profits. Here are the most important Six Sigma tools you can start using in your organization.
Value-stream mapping
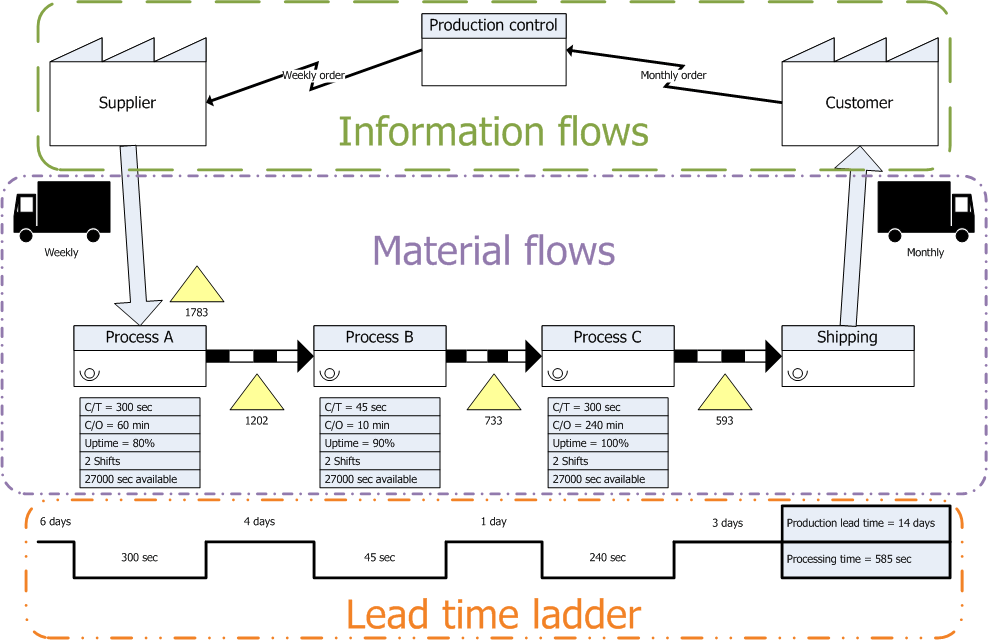 The value-stream map outlines the information and materials required to bring the product to its destination. This tool is useful for streamlining the production process.
Although value-stream mapping is primarily used in lean manufacturing, it can work for businesses in almost any industry. Its main goal is to visualize things like time period, error rate, and unnecessary delays within the process. A value-stream map consists of three different parts: the process map, the timeline, and the information flow.
It uses a unique set of symbols to help you better understand the process. The process map includes each of the steps involved in the business process.
The timeline comes from the process map and summarizes all the data on how long each stage takes. The information flow explains how each of these steps interacts with each other.
Trace every problem to its root cause
A cause-and-effect analysis diagram, developed by Kaoru Ishikawa, is also called a fishbone diagram because it resembles a skeleton of a fish. It’s one of the most famous Six Sigma tools, and it lets you brainstorm various causes of a problem.
The first step in performing the analysis is to identify the problem you want to solve. Write down who works on the process, and when and where the process occurs. Next, write the problem in a box on the left-hand side of the paper. Then draw a horizontal line from the center to the other end of the paper. From there, draw vertical lines off the “spine.” On these lines, write the major reasons behind the problem and think through any possible causes. You can further break these causes down into sub-causes. Once you complete the diagram with all possible causes of the problem, you can analyze your results. The results may need further testing and analysis.
5 whys
Organizations often find that one and the same problem occurs over and over again. No matter how many times they address it, it keeps creeping back in at a later date.
Problems that won’t go away are the symptom of a deeper issue that you need to resolve. To get to the root of chronic issues, you can use the tool known as the 5 whys. The 5 whys originated in the 1930s, developed by Sakichi Toyoda during the Japanese industrial revolution. The method’s simple: when the problem arises again, you get to the cause by asking “why” five times.
This method’s most effective when used to deal with moderately difficult problems. If you deal with more complex issues, you may achieve better results by using a cause-and-effect diagram.
The 5 whys sounds like a very unsophisticated method, but don’t underestimate it. Its simplicity is what makes it so useful. And this tool works well in combination with other Six Sigma tools.
Kanban system
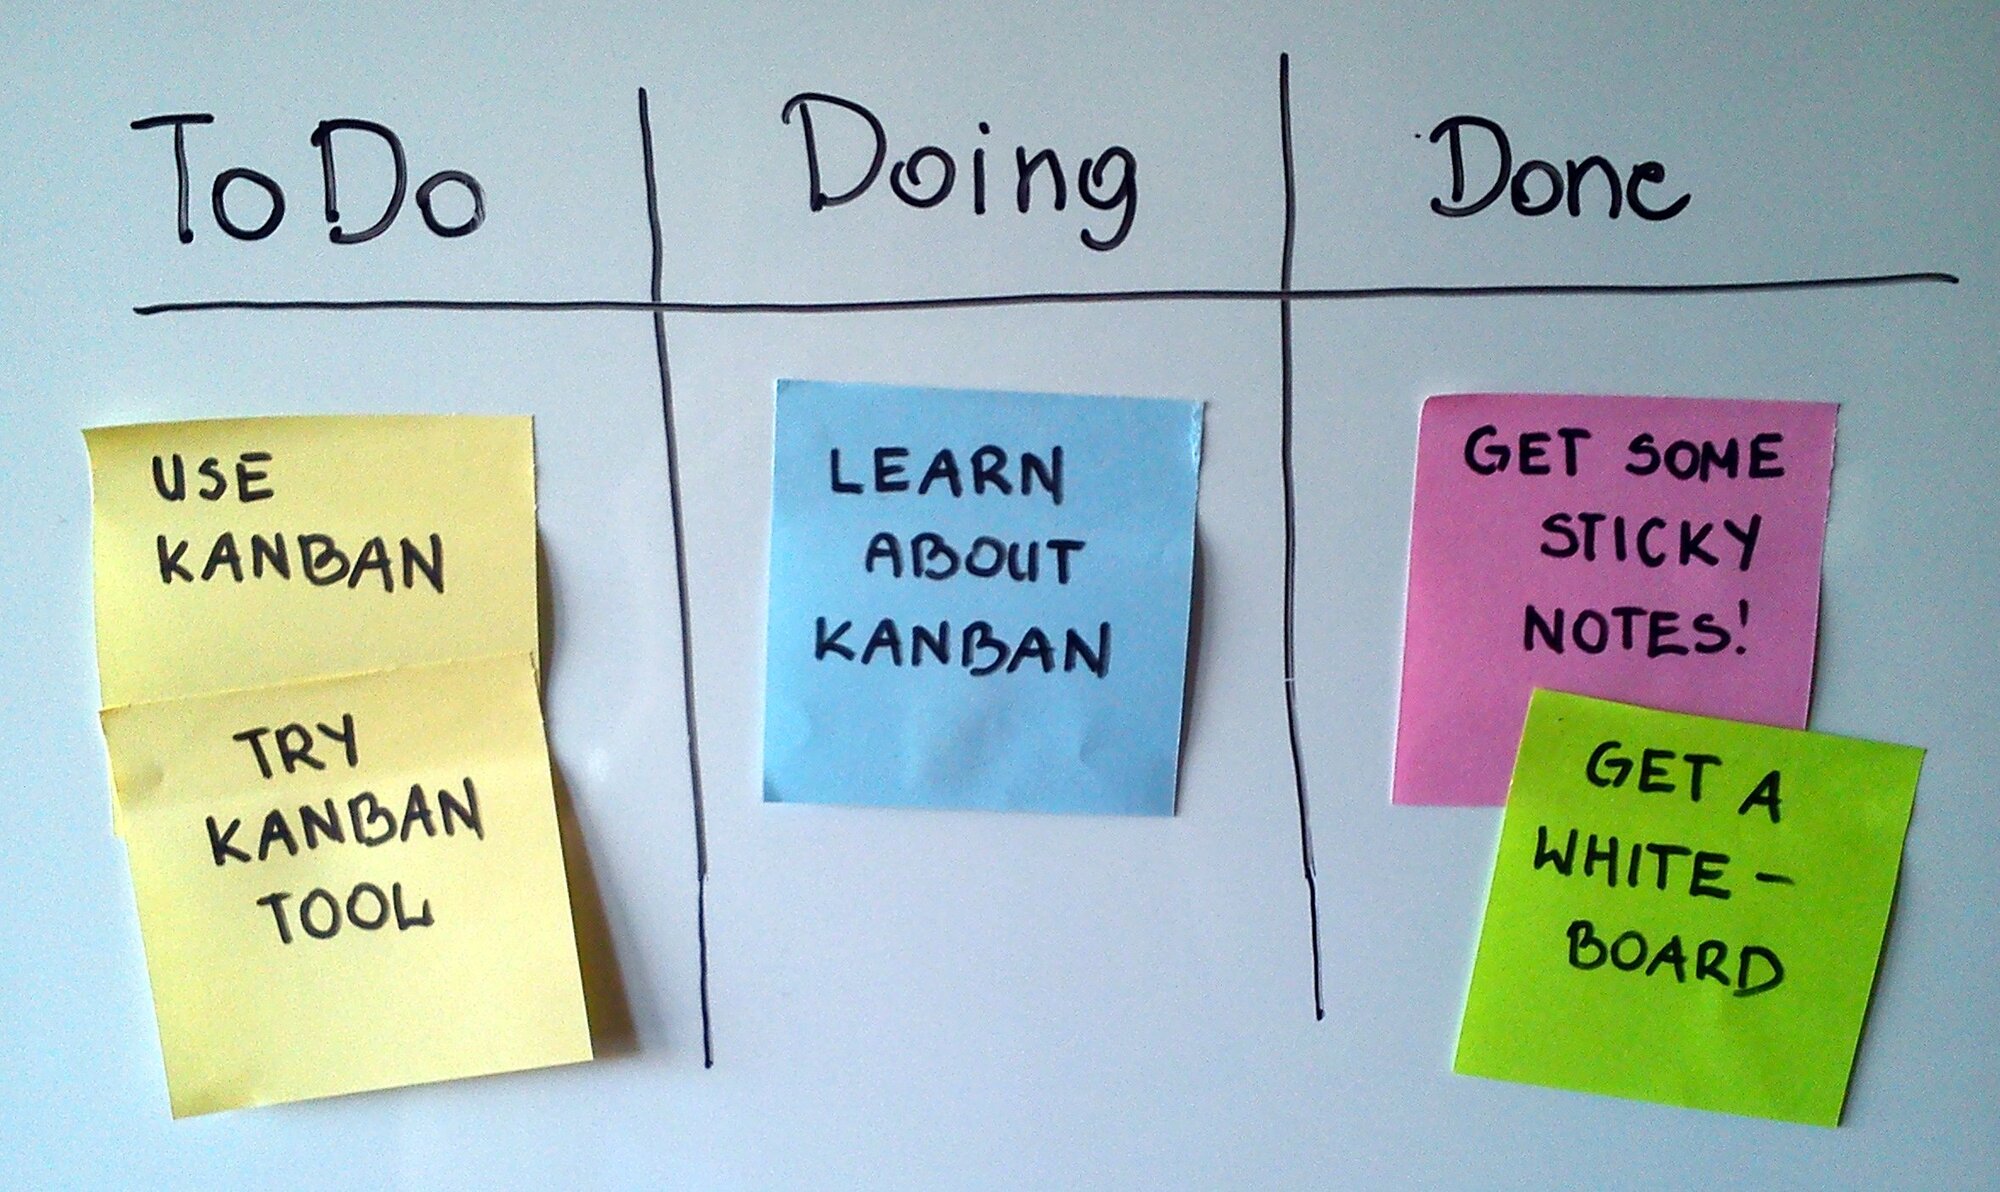 Kanban System is a supply chain control system that focuses on cost reduction by implementing just-in-time inventory control. It’s also one of the most popular Six Sigma tools, due to its ease of use and potential benefits.
“Kanban” is Japanese for “billboard.” The term was coined by Taichi Ohno, an industrial engineer at Toyota. Ohno based his system on how supermarkets match their inventory to demand. When you shop at a supermarket, you don’t stock up for months or years ahead.
Neither does the store stock items that it doesn’t expect to sell right now. Instead, you tailor your shopping list to what you need right now, just like the store bases its supply on demand.
Kanban mimics this arrangement by letting demand for the firm’s output control the supply of its inventory. The Kanban system sets limits for inventory-holding across all current business processes. This frees up resources and lets you use them better.
The whole thing works on a brilliant and simple idea: only activate the supply chain when the demand requires it. This both brings more focus to the business process and increases its efficiency.
Control charts and process variation
Here’s something Deming drilled into quality circles decades ago: uncontrolled variation is the enemy of quality. He wasn’t being dramatic. Most process failures aren’t caused by some big obvious disaster. They’re caused by small variations that creep in over time until suddenly you’re producing garbage and nobody can pinpoint when it started.
Control charts solve this by giving you a visual heartbeat of your process. You plot your measurements over time with upper and lower control limits. When data points stay between those lines, your process is stable. When they start wandering outside or showing weird patterns: trending upward, clustering, anything non-random. Something’s changed. The process is telling you to pay attention before it becomes a real problem.
The tricky part? Not every variation needs a fix. Control charts help you distinguish between “common cause” variation (the normal noise in any system) and “special cause” variation (something actually went wrong). Mind you, chasing common cause variation is a waste of time. Ignoring special cause variation is how small problems become expensive disasters.
Pareto chart
 Pareto Chart, named after economist Vilfredo Pareto, is a graphic representation of the Pareto Principle: 20 percent of input produces 80 percent of output in any given situation. The chart combines a vertical bar graph and a line graph.
The bar graph represents the metrics of various business process components, ordered from the largest to the smallest one. The line graph represents the cumulative total of these metrics. A Pareto Chart visualizes what part of the process influences output the most.
To create such a chart, you first figure out the components of the process and how to measure them. Once you’ve done that, you can put this data into a Pareto Chart.
This helps you see how big of an influence on the outcome each component has. It also gives you a clear idea of what requires your immediate attention.
FMEA - prevention over firefighting
Most Six Sigma tools help you fix problems. FMEA, or Failure Mode Effects Analysis, helps you prevent them before they happen. It’s basically asking “what could possibly go wrong?” in a structured way.
Here’s how it works. You list every step in your process, then brainstorm what could fail at each step. For each potential failure, you score three things: how severe would the impact be, how likely is it to happen, and how detectable is it before it causes harm? Multiply those three scores together and you get a risk priority number. High numbers get attention first.
The detection part trips people up. A failure mode that’s extremely likely but also extremely obvious might be less risky than something rare but invisible until it’s too late. FMEA forces you to think about this. Every time we onboard a new team, the same issue surfaces with workflow automation, we’ve heard the same frustration from operations teams. They spend all their time on firefighting rather than prevention. FMEA shifts that balance. It’s not glamorous work, but neither is telling your boss why the same problem won’t go away.
Process mapping
 Business process mapping is a way to visualize the business process and better understand how it works. A typical map outlines the roles, responsibilities, and standards involved in the process.
It presents this data in a structured way that shows the steps of the process along with who’s responsible, what the inputs and outputs are, and other information relevant to the process.
Visualization matters. Running Tallyfy taught us, we’ve heard from healthcare organizations managing 40,000+ users and 87,000 documents that process visibility is the single biggest pain point. Without clear maps showing who approves what and when, policy compliance becomes guesswork rather than a systematic control.
Business process mapping is probably one of the best aids in problem-solving. It visualizes the entire process, which makes it easier to see what’s wrong and get straight to the root cause. It also helps to clarify the roles of the people within the process and ensure everyone knows what to do.
Beyond that, business process mapping is great for finding potential risks the process creates. Constructing a map makes you rethink each step and see if there are any liabilities hidden within.
Types of process maps
Whether you use business process mapping to see the big picture or to concentrate on the details, you can choose a map that works best for your goal.
- Flowchart is the most common type of process map. While this process map is less flexible, you can easily draw it by hand or in software like MS Office. Flowcharts are often used for the creation of workflow diagrams.
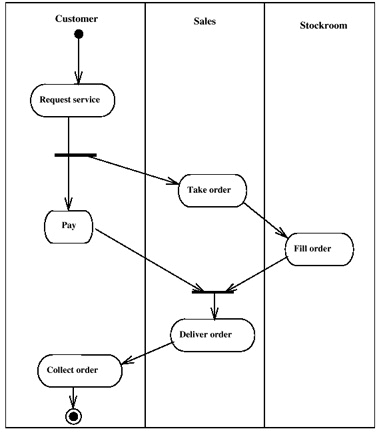
- Swimlane diagram is similar to generic flowcharts, except it’s better structured in terms of which job title does which task.
- Value stream map is a more in-depth alternative to the flowchart. It’s common for lean Six Sigma operations, and you may find it harder to analyze at a glance.
- SIPOC Diagram (Supplier Inputs Processes Outputs) is the most visually simplified map. It focuses on the essentials of the process and the people involved. By stripping all extra information, it defines a complex project better in terms of its basic elements.
Project charter
Project Charter is a document that defines the purpose and scope of the project. It works both as the template for the business process and as legal authorization of the project.
A project charter usually includes the project overview and its scope, details about the team and the resources, and the timeline. It gives you all the basic information about the project and clarifies the main points about it. The main benefit? It keeps things less chaotic.
Once a team dives into the project, it’s easy to lose track of who’s responsible for what, which deadlines the team has to meet first, and so on. If the company doesn’t have a clear managerial hierarchy, things get even messier.
Having a project charter helps you keep a clear focus on what your project is all about. It helps you understand the project’s structure and the relationship between the people involved. In other words, a project charter helps you bring your firm back to order when confusion sets in.
RACI matrix
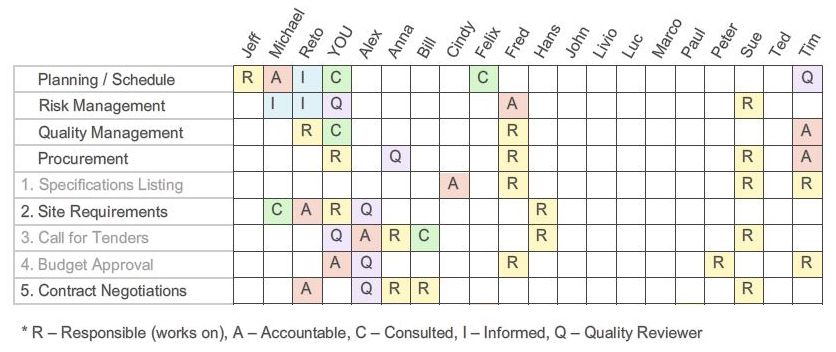 Responsibility Assignment Matrix, also known as RACI matrix, is a table that describes the responsibilities of each team member on every task of the business process. RACI stands for Responsible, Accountable, Consulted, and Informed, the key responsibilities most commonly used in the matrix.
Responsible refers to those whose role is to achieve the task. Accountable is the person who assigns tasks to others and monitors progress. There’s always only one accountable per task.
Consulted are the subject matter experts whose opinions guide the people who work on the task. Informed are the people you notify once you complete the task.
Typically, a RACI matrix has the tasks specified on the left of the table and the team members listed in the top row. The cells at the intersection of the two have the letter corresponding to what the person handles within the task. This simple system helps every team member clearly understand their role in the process.
It also lets you see the gaps in the team structure and which roles you need to fill.
Process stapling - see the work as it really happens
All these tools share a weakness: they work on your description of the process, not the process itself.
And descriptions lie.
Not on purpose, but because the person writing them down isn’t the person doing the work eight hours a day.
Process stapling fixes this. The concept is simple. You metaphorically “staple yourself” to a document, request, or piece of work and follow it through every step. Watch where it sits idle. See who handles it and what they actually do. Notice the workarounds and shortcuts nobody documented because “that’s just how we do it.”
It sounds obvious, but I’m consistently surprised how rarely it happens. Teams will spend weeks mapping processes in conference rooms when they could learn more from a single day of direct observation. The formal process says approval takes two steps. The stapled observation reveals it bounces between three inboxes because someone’s always on PTO. That’s the kind of insight that turns a mediocre improvement into a real one.
Are you using the right tools?
What busywork costs your company
per week
per year
over 5 years
Put Six Sigma principles into practice
These templates help you set up quality control workflows with built-in inspection checkpoints, root cause tracking, and standardized processes.
Picking the right implementation approach
Strategies for implementation vary based on the organization and specific business goals. Companies typically choose between two approaches: a case-by-case initiative or a full Six Sigma infrastructure.
A case-by-case initiative involves certain employees learning specific tools they can apply to jobs as needed. Other employees consult with that person when they need help. This method can produce results but rarely leads to major organizational changes.
By creating a Six Sigma infrastructure, you use it through projects rather than just individual tools. This is often a more focused and productive way to put Six Sigma tools to work. It can also lead to a more detailed understanding of important business processes.
In spite of its many successes, over 60 percent of Six Sigma projects don’t achieve the desired results. More often than not, the reason isn’t being able to enforce the changes made to processes. Is this a tools problem? Not really. Teams often nail the analysis phase but struggle with the Control phase because there’s no system to ensure people actually follow the improved process consistently.
We’ve observed that operations teams hit this wall more than anything else. Process management software can help. Tallyfy helps establish and enforce standardized processes so your business runs the way it should. Agents without workflows don’t automate work. They generate confusion at scale. But nobody’s building the workflows they need to follow. Tallyfy fills that gap by giving structured workflow patterns that both people and AI agents can follow.
Related questions
What are Six Sigma tools?
Six Sigma tools are a mix of problem-solving methods used to help improve business processes. They can help companies avoid costly errors, reduce expenses, and improve satisfaction across the board. Common Six Sigma tools are process maps, cause-and-effect diagrams, and control charts. Think of them as a Swiss Army knife of business improvement. Each tool has a purpose and is designed to deal with different aspects of a problem.
What are the 6 parts of Six Sigma?
The six components of Six Sigma are the steps of the DMAIC process: Define, Measure, Analyze, Improve, Control. Wait, that’s only five?
You’re right. The people are considered to be that sixth element. They include the team members and the leaders who drive improvement forward. This human aspect is essential, because all the best tools are useless if not employed by skilled hands.
What are the Six Sigma steps?
The Six Sigma steps follow the DMAIC acronym: Define the problem, Measure current performance, Analyze root causes, Improve the process, and Control the new solution. Each stage builds on the one before it, from problem recognition through implementation to sustained control. This disciplined process keeps teams on target with tangible results.
When to use Six Sigma tools?
Any time you’re looking to solve a tough problem or improve business performance, you can turn to these Six Sigma tools. They’re particularly useful when you’re addressing a known issue, dealing with repeated complaints, or when you’re trying to achieve close-to-perfect quality. Think of yourself as a detective where Six Sigma methods are your magnifying glass and fingerprint kit. They help you find clues and piece together answers.
What are Six Sigma QC tools?
The Six Sigma quality control (QC) tools are specific techniques used to monitor and improve product or service quality. These “7 QC Tools” are: 1) Pareto charts 2) cause-and-effect diagrams 3) check sheets 4) control charts 5) histograms 6) scatter diagrams 7) stratification. Each one has a specific strength for battling defects and variability in your processes.
How to pick the right Six Sigma tools?
Selecting the appropriate Six Sigma tools depends on the situation and what you need. Start by articulating your problem or objective in simple terms.
Then think about what your data looks like and where you are in your project. For instance, a fishbone diagram is great for brainstorming causes, while a control chart tracks ongoing process performance. Many of the most successful Six Sigma practitioners use more than one tool at a time to address thorny problems.
How is Six Sigma different from other improvement methods?
What sets Six Sigma apart is its commitment to data and statistics. While Lean focuses primarily on eliminating waste and Agile emphasizes adaptability, Six Sigma’s focused on reducing variation and defects. It’s the difference between saying “this room feels hot” versus using a thermometer to confirm it’s exactly 78.6 degrees and then a methodical search for the root cause.
How long does it take to put Six Sigma into practice?
Real results typically require an organizational shift that takes months to a year. A small team could finish their first improvement project in 3-4 months, but an enterprise-wide rollout can be a multi-year effort. The trick is balancing quick wins (to create momentum) with more in-depth, systematic changes. Six Sigma isn’t a project. It’s a capability you’re trying to build into your organization’s DNA.
What are the common challenges in Six Sigma?
The biggest hurdles rarely involve the technical aspects. The real challenges are human: resistance to change, leadership commitment that fades when quick wins don’t show up, and the struggle to maintain momentum when everyday fires demand attention. Another obstacle is data collection. Many organizations are surprised to discover they don’t actually measure the things that matter most. The most successful rollouts have strong executive sponsorship, clear communication about the “why,” and celebrate small victories along the way.
What are the levels of Six Sigma certification?
The colored belt system was borrowed from martial arts. The typical progression: White Belt (basic awareness), Yellow Belt (understands fundamentals), Green Belt (applies best practices to projects), Black Belt (leads complex projects), and Master Black Belt (trains others). Each level represents deeper specialization in statistical methods and problem-solving approaches. Green Belts can work on improvements part-time while Black Belts frequently become full-time change agents.
