A process flowchart is a visual map of how work actually gets done: every step, every decision point, every handoff between people. If you can’t see your process, you can’t fix it. And if you can’t fix it, automating it with AI just means the mess scales faster. Here’s how to draw one that’s worth the effort, and how Tallyfy turns static diagrams into living, trackable workflows.
Summary
- Four use cases justify the effort - Understanding how processes work, improving them by removing or automating steps, standardizing execution so everyone follows the same method, and writing Standard Operating Procedures with full documentation
- Three creation methods offer different value - Pen and paper is simplest, online graphing software (like LucidCharts) makes editing easier, while Business Process Management Software automates execution by automatically assigning tasks when steps complete
- Information gathering separates theory from reality - Consult frontline employees to understand exact steps, variables and events that trigger deviations, and who is responsible for each part, since processes that look great on paper often fail in practice
- Need help creating and managing process flowcharts? See how Tallyfy visualizes and automates workflows
Tallyfy is the only product available that does Process Documentation and Process Tracking in one
What a process flowchart really is
A business process is a series of repeatable tasks your business needs to carry out to hit some kind of goal. Flowcharts are how you visualize that process. They’re the map.
Process flowcharts, first developed by Frank Gilbreth in 1921, are a core part of business process mapping work. They make your processes visible, which makes them dramatically easier to understand. That sounds obvious. Turns out, it isn’t.
Every time we onboard a new team, the same issue surfaces with workflow automation, we’ve watched teams argue for months about how a process works, only to discover, once someone drew the flowchart, that nobody was doing it the same way. Not even close.
Why do people draw them? A few big reasons:
- Understanding how a process works - You can’t improve what you can’t see.
- Improving the process - Once you see it, improvements jump out. Maybe you can cut three steps. Perhaps two should run in parallel. Or one step shouldn’t exist at all.
- Standardizing a process - Without documentation, your employees will invent their own methods. Some will be brilliant. Most won’t. A flowchart gets everyone on the same page about how work should happen.
- Writing a Standard Operating Procedure - A flowchart is just the diagram. SOPs are the full documentation: how the process functions, how to carry it out, what tools to use. Running Tallyfy taught us with logistics companies and banks, they often maintain flowcharts with hundreds of shapes across dozens of slides to document operations like cash migrations or warehouse fulfillment.
To get real value from your processes, you’d want to tackle all four.
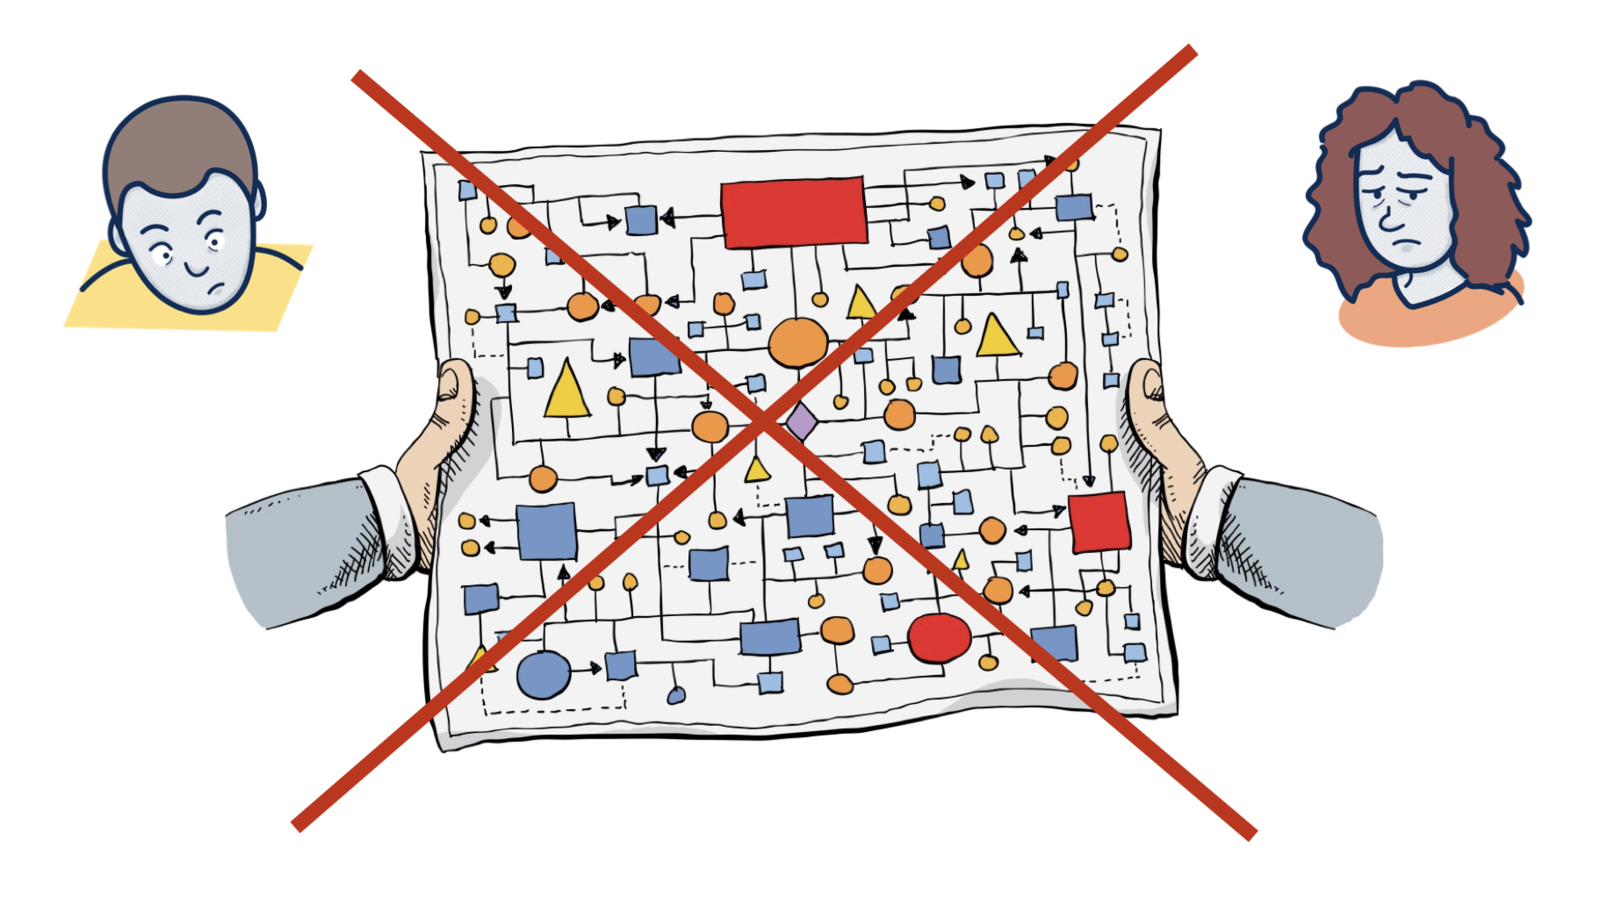
Look - the thing that frustrates me though. Most organizations basically stop at the drawing. They create a beautiful flowchart, stick it in a shared drive, and never look at it again. The process drifts. The diagram becomes fiction. That’s why at Tallyfy, we believe flowcharts alone aren’t enough. You need a system that runs the process, not just pictures it.
How to draw a process flowchart
At a glance, this sounds simple. Everyone can draw a flowchart. Making it accurate? That’s another story. It’s one thing to view the process from a management perspective. It’s quite another to understand what it actually consists of: the steps, the tools, the workarounds nobody talks about.

First, decide if a flowchart is even the right tool
Before diving into the process details, make sure a flowchart is what you need.
If your aim is process analysis from a higher level, other tools might serve you better. Flowcharts are great for step-by-step detail, but they don’t always give you the bigger picture.
A SIPOC diagram, for example, analyzes the entire chain of product creation and delivery. It breaks down into 5 parts: suppliers, inputs, processes, outputs, and end users.
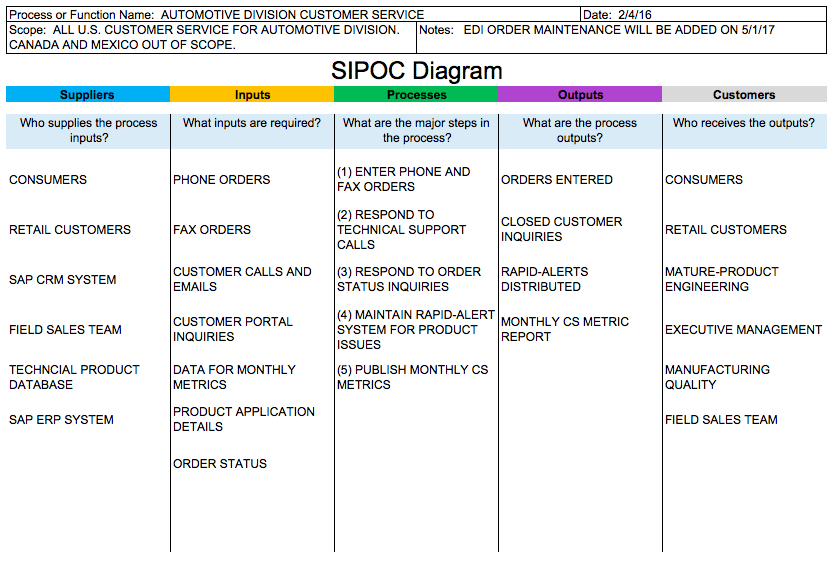
Looking for more top-level analysis tools? Check out our guide on business process improvement tools.
Then, gather the right information
Unless you’re the person working on the process daily, you probably need to catch up on the details. Even if it seems simple at a glance, there are small details that add up. You’d want to know:
- What the exact process steps are
- Variables and events - in which situations do you deviate from the process?
- Who is responsible for each step
So consult the people who actually do the work. Set up a meeting. Pick their brains. This matters more than you think.
Based on hundreds of implementations, frontline employees consistently identify improvements that managers miss. Funny how that works. We’ve seen this pattern repeatedly when mapping processes across financial services (17%), healthcare (11%), and manufacturing (8%) organizations. One glass installation company mapped their entire workflow from initial contact through post-installation follow-up. Their flowchart spanned 22 distinct steps across customer service, estimating, operations, and installation phases.
Finally, create the flowchart itself
Once you have the information, you can draw the flowchart. If you want to keep it simple, use the basic process symbols:
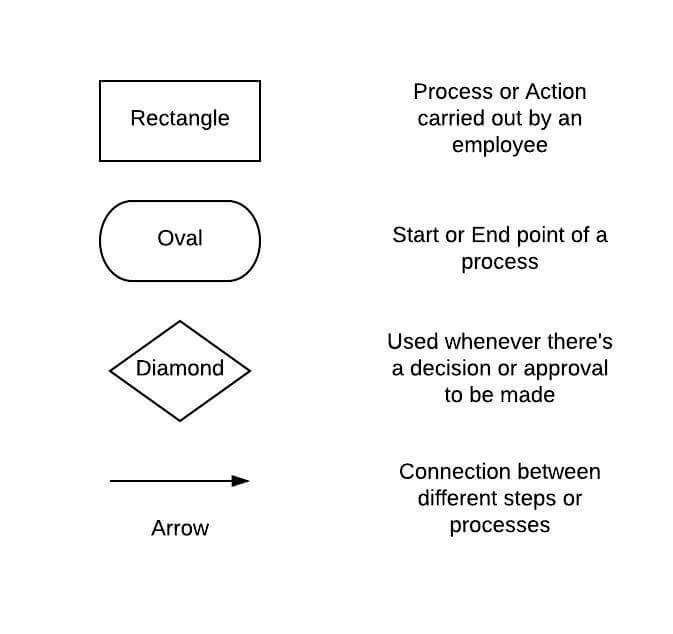
A better (but a bit more involved) option is BPMN2.
Business Process Modeling and Notation (BPMN), first formalized by Stephen White at IBM, is a standardized method for documenting processes. Well, “standardized” is generous. Following the BPMN model makes it easier for your employees, management, and external consultants to understand the process map.
Want to go that route? Read our guide on BPMN here.
Whichever method you choose, there are 3 ways to draw it:
-
Pen and paper - The simplest option. Grab a piece of paper, a pen, and draw it physically. Done.
-
Online graphing software - You’re probably going to want it digital. This makes editing and sharing much easier. Use a tool like LucidCharts or Microsoft Visio.
-
Business Process Management Software (BPMS) - While BPM software rarely helps create flowcharts directly, it does something better. You can use BPMS to create digital processes that you can analyze or execute through the system. The software automates process execution: when a step is completed, the next person in line automatically gets assigned the right task.
BPMS can be tricky to understand at first. Learn about how different process management systems function with our guide to BPM solutions.
Flowcharts are read-only objects. Workflows are run. See the difference at /alternatives/bpm/.
Three process flowchart examples
You can create process flowcharts for just about any business process: onboarding, sales, document approval, you name it. Here are 3 examples from different industries.
Employee onboarding
Every company hires new people. Onboarding is how you get them up to speed: educating them on how the company or department works.
So it’s always smart to have a clear, structured process. Does every company need one? Obviously. While it varies between organizations, here’s a basic example:
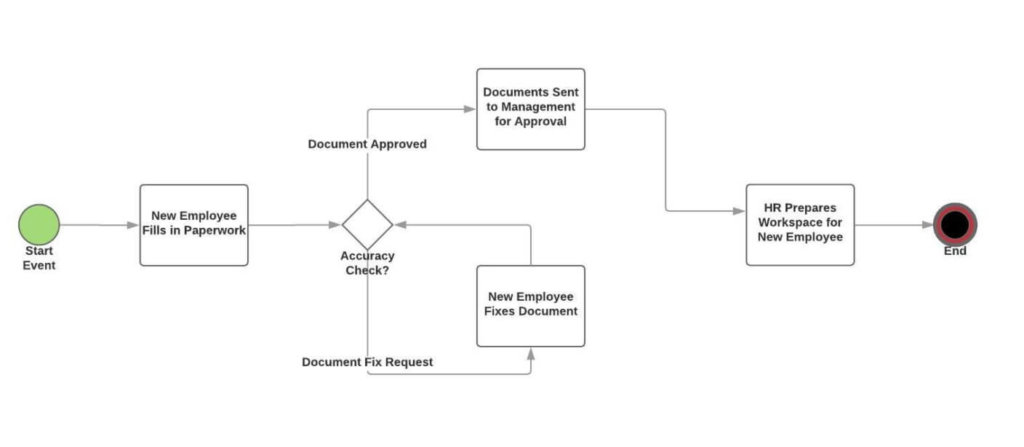
- HR gets the new employee to sign the documents and legalities
- The documents go through an approval process between HR and management
- HR notifies company employees about the new hire via email
- Office manager prepares the necessary supplies and handouts
- Tech - software access, personal computer, etc.
- Welcome swag - gifts, company t-shirt, etc.
- Onboarding materials
- Entrance ID
As a process flowchart:
Need help creating your own onboarding process? Learn how to get employee onboarding done right.
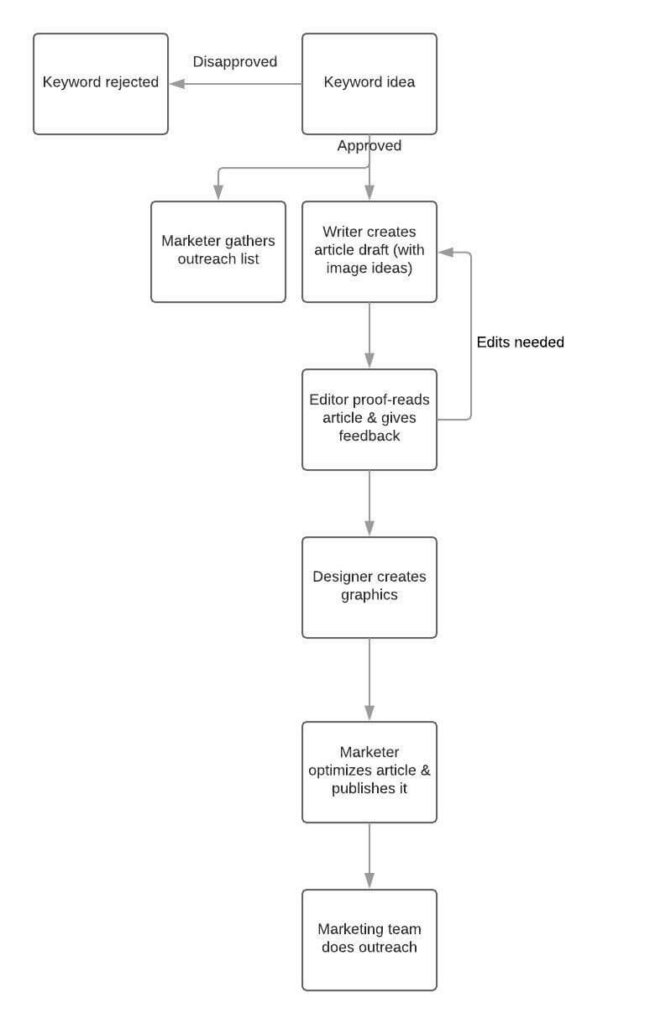
Document approval
Getting all the right approvals for any document can be a proper headache. It involves a lot of emails back and forth, some of which get lost or delayed.
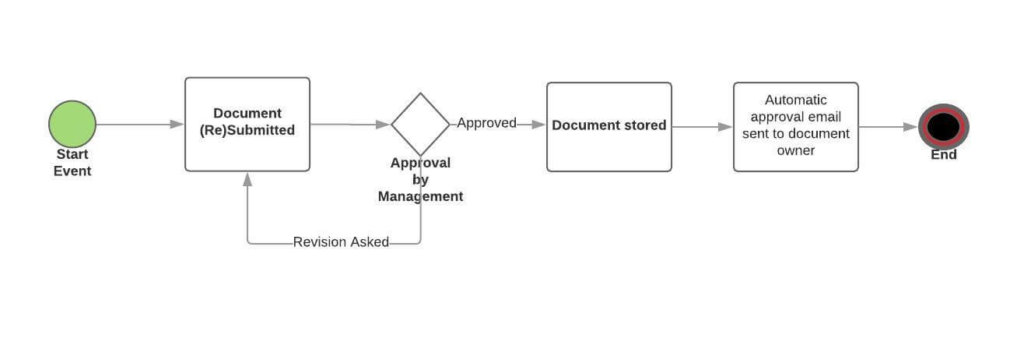
Having a procedure makes approvals much faster and more efficient. Here’s a basic document approval process (it applies to legal, HR, or pretty much any type of document):
- The document is submitted
- If the document is disapproved, process canceled
- If approved, the document is stored in a relevant folder
- Automatic email sent to any relevant party
As a flowchart:
To make this process even smoother, you can use approvals management software. Instead of shooting emails back and forth, you’d start the process through Tallyfy and the system makes sure everyone signs at the right time.
Incident response
Any company should have a contingency plan for potential incidents. You can’t always predict what’ll happen, but you can have a strategy for how to react. Will it cover everything? No.
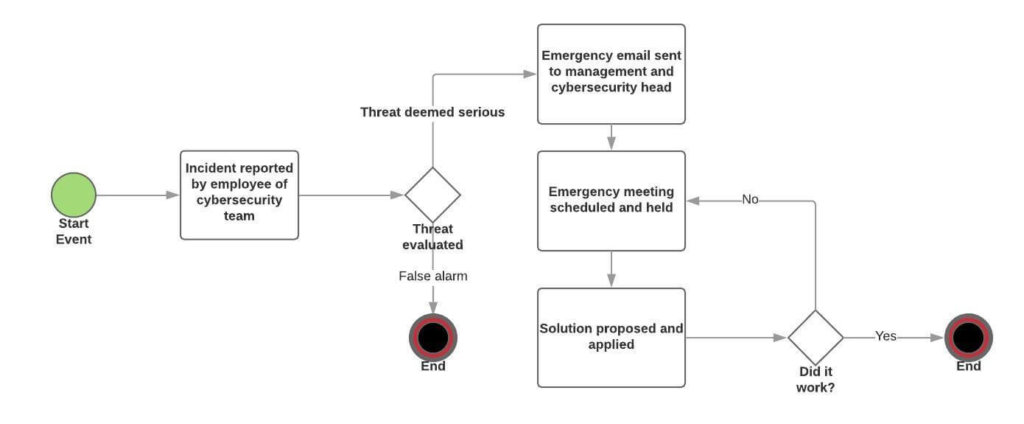
This flowchart example covers a cyber attack:
- The emergency is reported by an employee after discovering an identified USB plugged into their computer
- The security team evaluates the threat. If it’s a false alarm, the process ends
- Emergency email sent to relevant company executives
- Management and the security team hold an emergency meeting
- The solution is proposed and applied
- If the solution didn’t work, the process rolls back to step 4. If it does, the process is completed
As a flowchart:
Want to learn more? Read up on incident response management processes.
Why flowcharts alone aren’t enough
Creating process flowcharts is useful for introspection, but it’s only a start.
You still need to analyze the process, figure out potential improvements, and implement them. After all, you don’t get much by just drawing the flowchart and calling it a day.
Here’s what drives me crazy about this: We keep upgrading the engine while ignoring that there are no roads. Right now, nobody’s building the workflows those agents need to follow. So if your flowchart describes a broken, messy workflow, automating it just creates broken automation. Faster.
We’ve observed that operations teams who skip the analysis step waste about 60% of the effort they put into the whole exercise. The flowchart becomes shelf-ware. The process drifts.
To learn how to go beyond the diagram, check out our guide on Business Process Management. It’s not another buzzword article. It explains how BPM can actually help you improve your processes.
Are flowcharts still relevant?
Flowcharts are a starting point, not an end point. They’re useful for getting a shared understanding of how work flows. But in 2026, static diagrams feel like using a clunky paper map when you’ve got GPS.
The real question is: are you going to draw a process and forget about it, or are you going to make it executable? That’s the gap Tallyfy fills: turning flowcharts from wall decorations into workflows that actually run, track, and adapt.
What busywork costs your company
per week
per year
over 5 years
Common questions about process flowcharts
What is a process flowchart?
A process flowchart is a visual map showing how things get done. Think of it as a trail guide. Shapes and arrows walk you through each step of a process. If you were baking cookies, a flowchart would diagram every stage from gathering ingredients to pulling warm cookies from the oven. It turns confusing sequences into something you can see at a glance.
What is process flow and how does it work?
Process flow is the path a piece of work follows from beginning to end, like following a river from its source to the ocean.
Take ordering a pizza online. The flow goes something like this: you pick your toppings, place the order, the restaurant receives it, makes the pizza, a driver picks it up, and delivers it to your door. Each step feeds into the next. It traces a smooth path from hungry thought to meal in hand.
How do you write a flowchart for a process?
Start with an oval shape for the beginning. Use rectangles for action steps, diamonds for decisions, and arrows to connect everything. Keep it simple. Every shape should represent one main idea.
Pretend you’re teaching a friend how the process works. Use another oval when you reach the end. Your goal is to make the flowchart so clear that anyone can follow the story without getting lost.
What are the 7 steps of creating a flowchart?
Think of it like following a recipe. Step 1: collect your ingredients. That’s the list of process steps you want to map.
Step 2: write down every step in sequence. Step 3: pick your shapes: ovals for start and end, rectangles for actions, diamonds for decisions. Step 4: arrange these shapes in order. Step 5: draw arrows between shapes to show the flow. Step 6: add labels and details. Step 7: review your flowchart to make sure it’s clear and accurate. These seven steps turn a jumble of thoughts into a visual guide anyone can follow.
What are the 5 elements of a flowchart?
The five core building blocks are: symbols (shapes representing different actions or decisions), flow lines (arrows showing direction and movement), text (short descriptions inside each shape), sequence (the logical order of steps), and structure (how all the pieces connect to tell the story of your process). They work together like instruments in a band. Each one plays its part, and the result makes sense as a whole.
