SaaS metrics that drive real growth
Most SaaS teams drown in dashboards yet miss the metrics that predict survival. Bain and Company found that SaaS companies above the Rule of 40 generate roughly 3x higher returns.
SaaS economics are weird. You burn cash for months before a single subscriber turns profitable. Miss the right signals and you won’t know you’re dying until it’s too late. Here’s how we think about tracking what matters at Tallyfy, and how you can apply the same discipline.
Workflow Made Easy
Summary
- The Rule of 40% checks SaaS health fast - Add your growth rate percentage to your profit percentage. If the sum hits roughly 40%, you’re in decent shape. Bain & Company found that companies consistently above this threshold generate returns about 3x higher than those below it
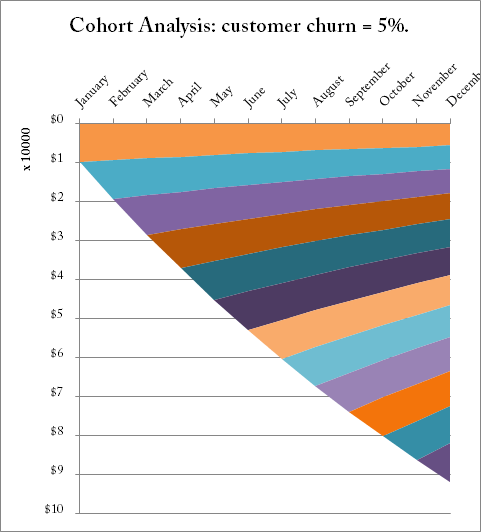
- Churn gets nastier as you grow - 5% churn at 100 subscribers is 5 lost. At 1,000 it’s 50. Replacing them gets harder every time, and benchmarks show the median early-stage company churns at 6.5% annually
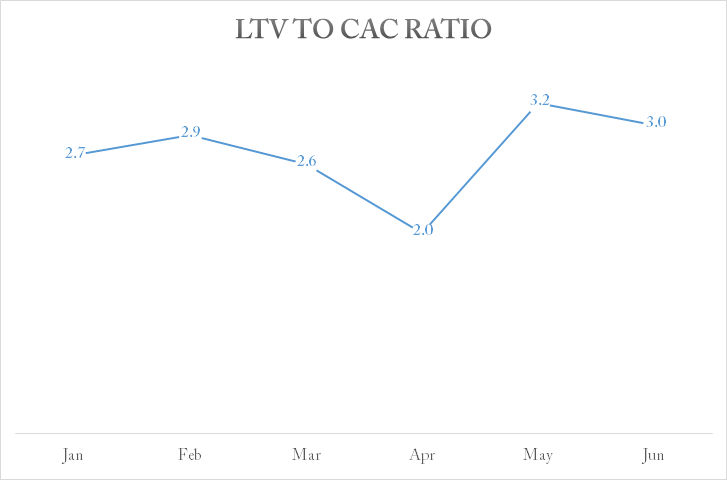
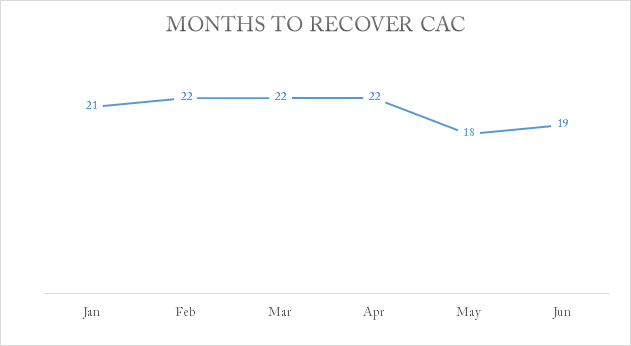
- LTV must be at least 3x your CAC - If it costs you more than a third of what a subscriber is worth over their lifetime, your unit economics are broken. Recover that acquisition cost within 12 months or you’ve got a problem
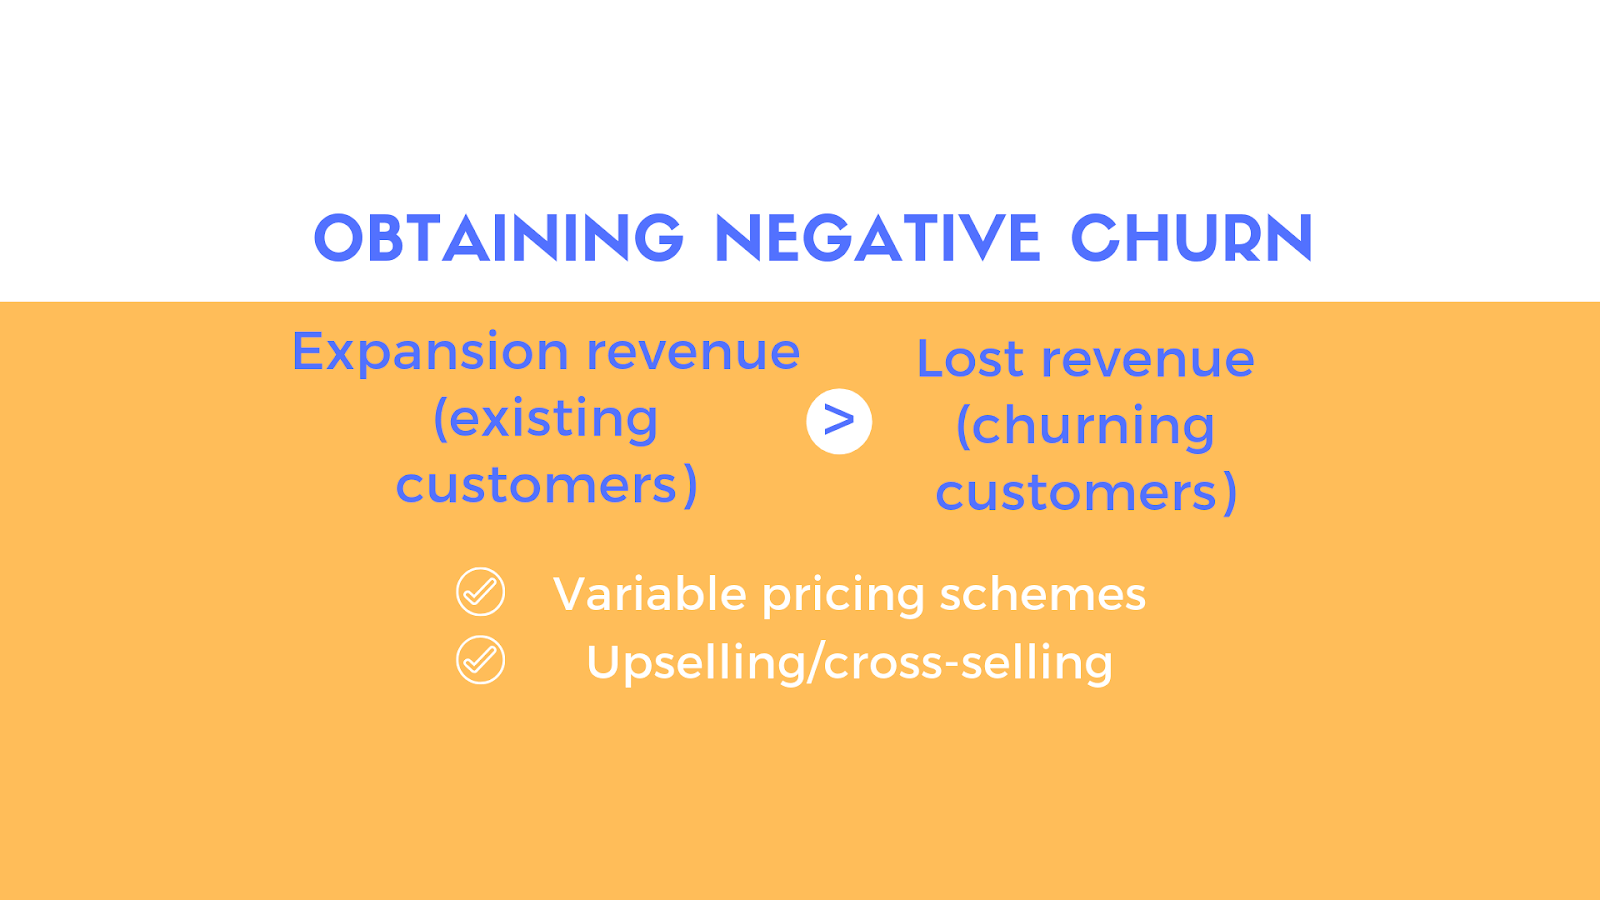
- Negative churn is the endgame - When expansion revenue from existing subscribers exceeds lost revenue from those who leave, you’re winning. ChartMogul data shows about 40% of SaaS businesses in the $15-30M ARR range have pulled this off. Need help tracking your business processes?
Why SaaS cash flow feels backwards
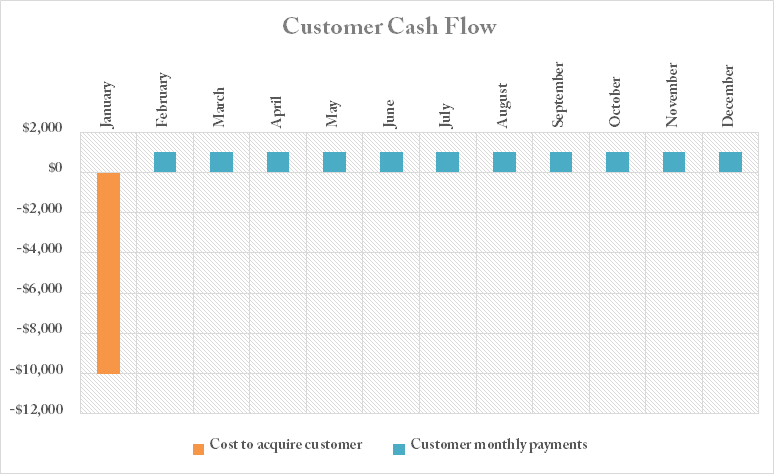
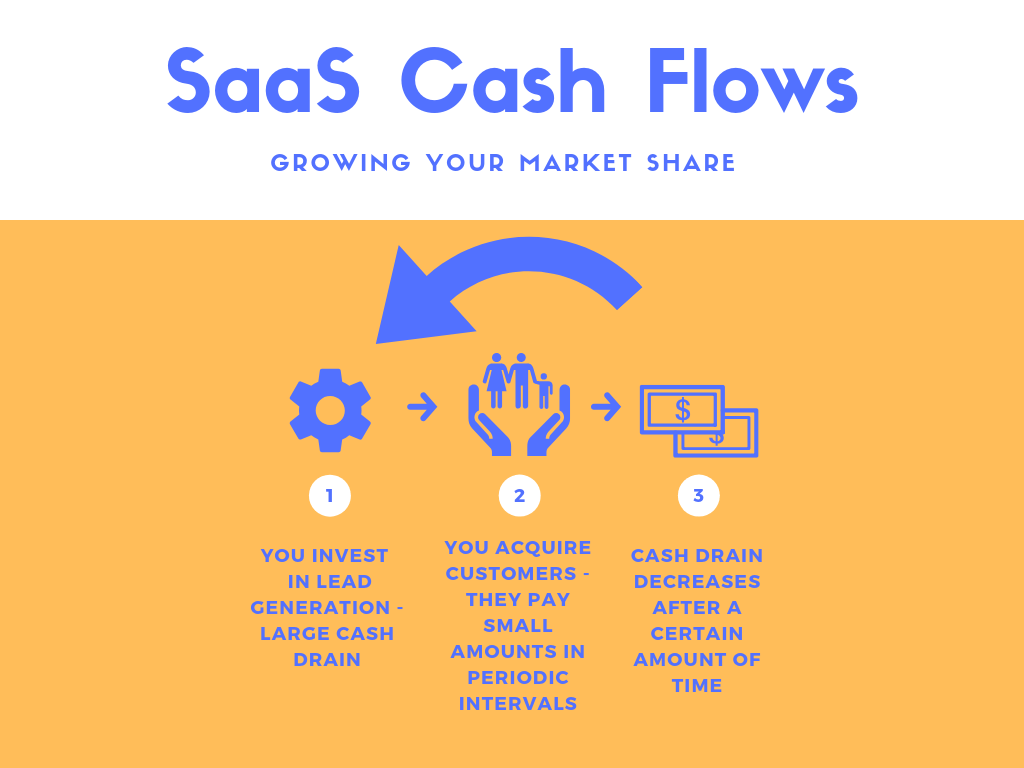
Here’s what nobody warns you about when starting a SaaS business. You’ll spend a fortune acquiring each subscriber, then wait months, sometimes a full year, before that person generates a net positive return. That’s just how the model works.
Think about it. Say you spend $10,000 on sales and ads to land a new subscriber in January, and you charge $1,000 per month. Your cash flow for that single account looks brutal at first:
And if you stack it all up over the year, the cumulative picture:
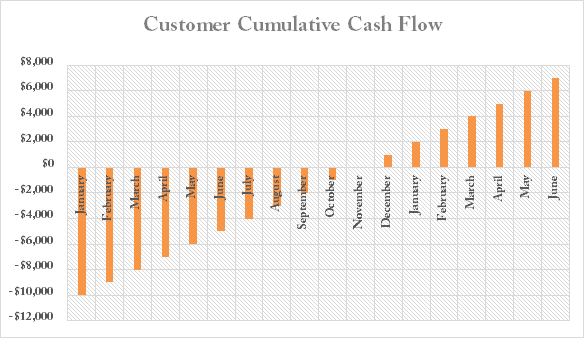
Turns out, it takes until roughly month 11 before you’re in the black on that one subscriber. The logic extends to your entire base. If you invest heavily upfront to acquire a larger group at once, your business hits profitability faster because all those subscriptions compound together to shorten the payback window.
Honestly, the biggest trap I see? When founders finally reach the profitability tipping point, they relax. They stop investing.
That’s exactly backwards.
The moment things start clicking is when you should be pouring money back into lead generation and hiring support. The question we get asked most often with SaaS founders, the ones who coast at the inflection point almost always lose ground to competitors who keep pushing. Your goal isn’t comfort. It’s market share.

Rule of 40% - a quick health check
This one’s simple. Take your growth rate as a percentage. Add your profit margin as a percentage. If the sum is around 40%, you’re in good shape.
30% growth + 10% profit? That works. 50% growth but negative 10% profit? Still fine. You’re investing in growth. Negative 20% growth but 60% profit? Mathematically it passes, but I’d be worried about the trajectory.
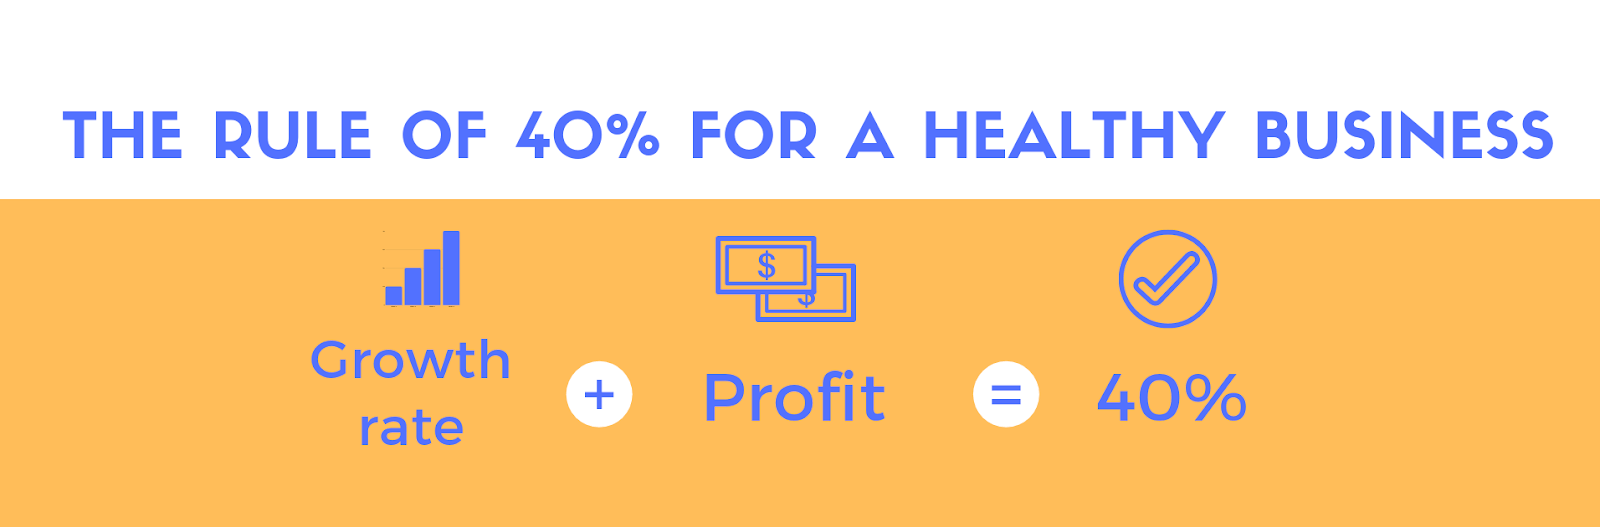
Bain & Company’s research on this is worth reading. They found SaaS companies that consistently hit the Rule of 40 generate roughly 3x the returns of those that don’t. It’s not a perfect diagnostic tool. Different companies measure profit differently (EBITDA, net income, free cash flow). But as a gut check? Hard to beat.
If you’re below 40%, something’s off. Either you’re not reinvesting enough of your profits, or the return on what you’re spending isn’t cutting it. The metrics below will help you figure out which one.
Churn - the metric that keeps founders up at night
Churn is the number of subscribers who cancel over a given period. Simple concept. But its impact compounds in ways that catch people off guard.
At 100 subscribers, 5% churn means 5 people leave. Annoying but manageable. At 1,000 subscribers with the same rate, you’re losing 50, and replacing all of them is genuinely hard. Benchmarks from Nick Franklin’s ChartMogul show that median early-stage companies (under $300k ARR) churn at about 6.5% annually, while more mature companies ($1-3M ARR) bring that down to around 3.7%.
If your churn is unusually high, your product is broken. Not your marketing, not your sales funnel. Your product. OK, that oversimplifies it a bit. Sometimes onboarding is the culprit. That’s a hard truth but an important one.
Negative churn is where things get interesting. This happens when expansion revenue from existing subscribers, through upsells, cross-sells, or usage-based pricing, exceeds the revenue lost from those who leave. ChartMogul’s benchmarks report shows about 40% of SaaS businesses in the $15-30M ARR range achieve negative churn. It’s not fantasy. But it requires deliberate pricing architecture.
Two ways to get there:
-
Variable pricing. Charge per seat, per user, per unit of whatever your product measures. As your subscriber’s business grows, they naturally spend more. At Tallyfy, this is baked into how we think about pricing. Per-seat models mean growth is shared.
-
Upselling and cross-selling. Offer additional capabilities to people who are already paying you. They already trust you. The friction is lower.
Cohort analysis and predicting who leaves
A cohort is a group of subscribers who signed up during the same time period. January signups form the January cohort. Track how each cohort behaves over the following months and you start seeing patterns.
What people miss about predicting churn: the fewer features someone uses, the more likely they are to leave. They’re not getting their money’s worth, so canceling feels easy. You can build a subscriber engagement score around feature adoption and usage frequency, then rank accounts from highest risk to lowest. It won’t predict perfectly, but it gives your team somewhere to focus.
This is where process matters. If your churn response is ad-hoc (someone notices a cancellation, fires off a panicked email), that “process” will break at scale whether you automate it or not. We kept hearing the same thing from teams who’d cracked it: they set up structured workflows for at-risk accounts that move the needle. Defined triggers, assigned owners, tracked outcomes.
Unit economics - LTV and CAC
Lifetime Value (LTV) is the total net profit you’ll make from one subscriber over their entire relationship with you. Cost to Acquire (CAC) is what you spent on sales, ads, and marketing to bring them in, divided by the number of new signups.
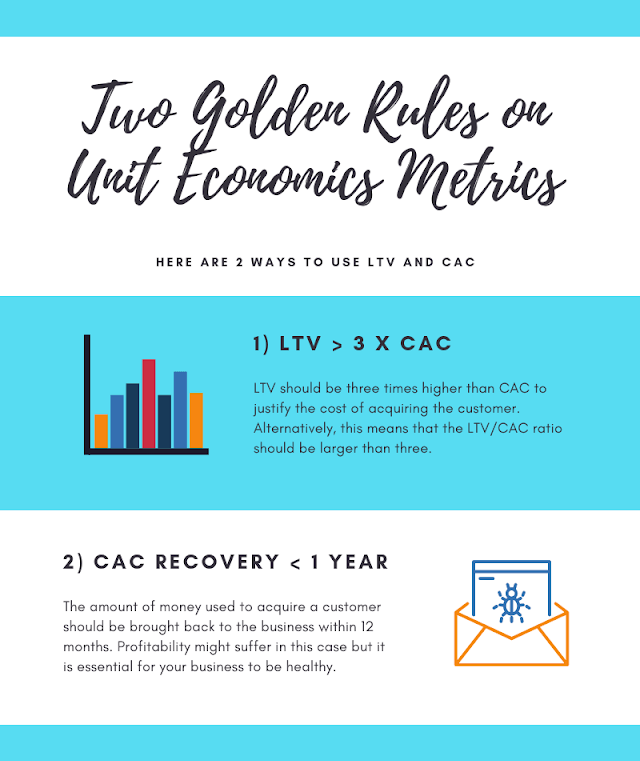
Two golden rules:
LTV should be at least 3x CAC. If it’s not, you’re spending too much to acquire people who don’t stick around long enough. Geckoboard’s analysis notes that top-quartile SaaS companies hit 5:1 or better. That gap is wild.
CAC payback should be under 12 months. You need to earn back your acquisition cost within a year. Longer than that and you’re running a charity. A CNBC analysis on silent failure at scale makes the point that companies scaling on bad unit economics don’t always fail loudly. The damage compounds quietly.
These ratios don’t just tell you whether your business is healthy. They tell you:
- When to invest. If your ratios are in the green zone, push harder. Reinvest.
- Which lead sources work. Compare LTV/CAC across different acquisition channels. Kill the ones that don’t perform.
- Which subscriber segments are most valuable. Some cohorts have wildly better LTV. Find those segments and double down on attracting more of them.
Recurring revenue - MRR and ARR
Depending on whether you bill monthly or annually, you’ll track either MRR (Monthly Recurring Revenue) or ARR (Annual Recurring Revenue). They measure the same fundamental thing: predictable income.
What moves these numbers?
- New subscriptions - fresh signups add to your base
- Expansion - existing subscribers upgrade, buy add-ons, or grow into higher tiers
- Churn - cancellations eat into your base
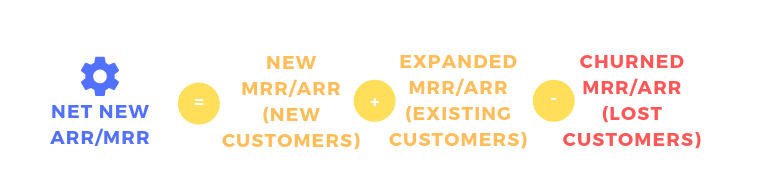
The metric that ties it together is Net New MRR/ARR: new revenue plus expansion revenue minus churned revenue. Plot all three together and you get a complete picture of where your revenue is going.
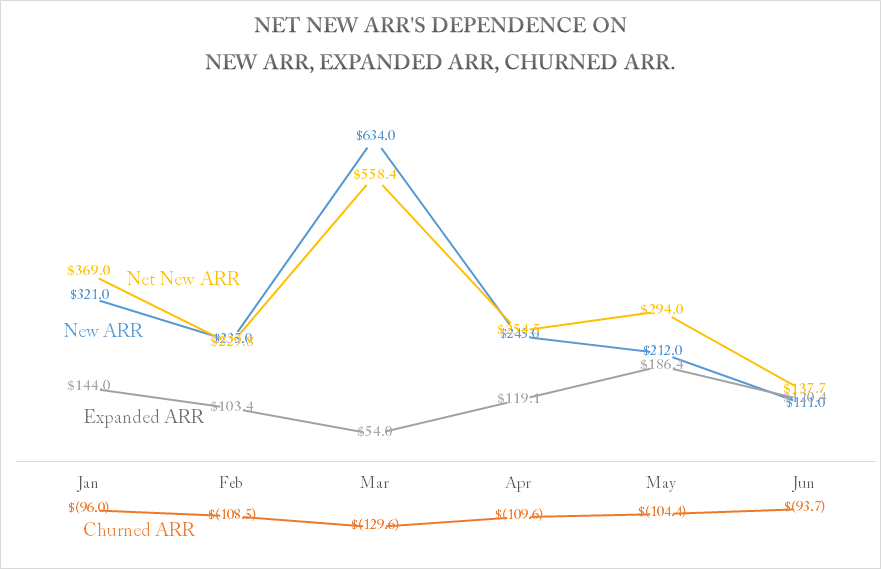
After watching hundreds of teams try this with workflow automation, the SaaS companies that track net new ARR religiously are the ones who catch problems early. Well, not always. But more often than not. When expansion flatlines or churn ticks up, they see it within weeks, not quarters. Tallyfy helps teams build trackable processes around revenue reporting so nothing falls through the cracks.
Are you hearing this at work? That's busywork
Enter between 1 and 150,000
Enter between 0.5 and 40
Enter between $10 and $1,000
Based on $30/hr x 4 hrs/wk
Your loss and waste is:
every week
What you are losing
Cash burned on busywork
per week in wasted wages
What you could have gained
160 extra hours could create:
per week in real and compounding value
Total cumulative impact over time (real cost + missed opportunities)
You are bleeding cash, annoying every employee and killing dreams.
It's a no brainer - improve your workflows
Funnel metrics - where leads leak
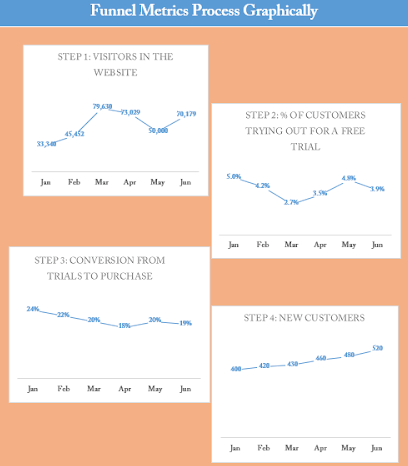
Funnel metrics map every stage of your acquisition process and measure how many leads survive each transition:
- Stage 1: Visitors hit your site
- Stage 2: Some sign up for a free trial
- Stage 3: A fraction convert to paid
- Stage 4: They become active subscribers
At each step, you measure the conversion rate to the next. One thing that surprised us talking to SaaS teams is that most don’t track this carefully enough. They know their top-line numbers but can’t pinpoint exactly where the funnel leaks.
Why does this matter? Say you spend $10,000 on ads and get 200 new paid subscribers. If next quarter you want 300, you can work backwards through your conversion rates to estimate the budget. That’s planning from data instead of gut feel. Does this guarantee accuracy? No.
But here’s what I find more interesting. If conversion from trial to paid is dismal, that’s a product problem. If conversion from visitor to trial is low, that’s a messaging or targeting problem. The funnel tells you where to fix things, not just that things are broken.
You can also spot bottlenecks in your onboarding process this way. If people sign up for a trial but never complete setup, you’ve got an onboarding gap, and that’s exactly the kind of repeatable process you can build and track in Tallyfy.
Track your SaaS metrics with these workflow templates
Automate lead tracking, onboarding, and upsell processes to improve LTV and reduce churn
The process problem nobody talks about
Here’s what ties all of this together, and it’s something I feel strongly about.
Most SaaS teams treat metrics as a dashboard problem. Get the right charts, hire a proper analyst, maybe plug in some BI tool. Done. Does any of that fix the real problem? No. But metrics don’t improve themselves. The processes behind them do.
Your churn rate won’t drop because you stare at it. It drops when you build a structured process for identifying at-risk accounts, reaching out at the right time, and resolving their issues before they cancel. Your CAC won’t improve from better dashboards. It improves when your sales process is documented, repeatable, and trackable.
That’s the mega trend I keep coming back to. Every SaaS company is talking about adding AI to their stack. But if your onboarding process is a mess of emails, Slack messages, and tribal knowledge, throwing AI at it just creates a faster mess. The companies that win are the ones who define their processes first, then automate.
Based on hundreds of implementations, we’ve seen this pattern over and over at Tallyfy. The teams that document their workflows before automating them get dramatically better results than those who automate chaos. They start by mapping their onboarding flow so they can see where people drop off. They build a structured churn response process with defined triggers and assigned owners instead of reactive panic emails. They create repeatable expansion playbooks that any account manager can follow, not just the one star rep who does it intuitively. They track each of these workflows with real completion data, not just dashboard metrics. And when something isn’t working, they can point to the exact step that’s breaking down. Whether it’s scaling your business or improving sales management, the principle is the same. Process first. Metrics second. Automation third.
That order matters more than any individual number on your dashboard.
About the Author
Amit is the CEO of Tallyfy. He is a workflow expert and specializes in process automation and the next generation of business process management in the post-flowchart age. He has decades of consulting experience in task and workflow automation, continuous improvement (all the flavors) and AI-driven workflows for small and large companies. Amit did a Computer Science degree at the University of Bath and moved from the UK to St. Louis, MO in 2014. He loves watching American robins and their nesting behaviors!
Follow Amit on his website, LinkedIn, Facebook, Reddit, X (Twitter) or YouTube.

Automate your workflows with Tallyfy
Stop chasing status updates. Track and automate your processes in one place.