SIPOC diagrams give you the foundation for process improvement, but turning that map into real action requires the right tools. Here’s how we approach process improvement at Tallyfy.
Summary
- SIPOC puts an entire process on one page - Suppliers, Inputs, Process, Outputs, and Recipients laid out in five columns. It’s a Six Sigma tool that gives unfamiliar team members a quick birds-eye view without drowning them in detail
- It’s the starting point for DMAIC and onboarding - The simple structure helps new people get up to speed fast and serves as the foundation for Six Sigma DMAIC strategy during the Define phase, so everyone shares a common language before going deeper
- Five columns, no decision trees, no feedback loops - Start with the Process column (key steps only), identify Outputs, list who benefits, note required Inputs, and specify Suppliers. See how Tallyfy documents processes
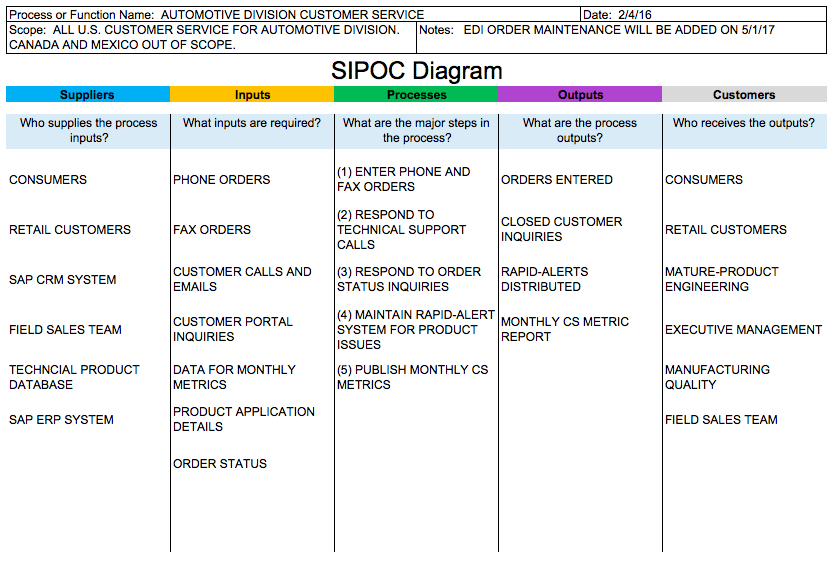
A SIPOC diagram is a Six Sigma tool used for documenting business processes at the highest level. The acronym stands for Suppliers, Inputs, Process, Outputs, and Recipients — five columns that capture the essential flow of any workflow from beginning to end. Because it doesn’t contain much detail, people sometimes call it a high-level process map.
Tallyfy is Process Improvement Made Easy
Quality and compliance discussions come up in over 1,500 combined mentions across conversations we’ve had with mid-market teams. That’s not surprising. Most organizations don’t have a simple, shared view of how their own work gets done. A SIPOC fixes that.
Why SIPOC diagrams matter more than you’d think
The real issue with process improvement is that everybody wants to jump straight to fixing stuff. But you can’t fix what you haven’t mapped. And you can’t map what your team doesn’t agree on.
That’s where SIPOC shines. It forces agreement.
The diagram works well for a few specific situations. First, it gives people unfamiliar with a process a high-level overview — no training manuals, no 40-page SOPs. Just one page. Second, it’s perfect for onboarding someone new or refreshing someone who worked on the process months ago. Third, and this is the big one, it kicks off problem-solving by making sure everybody’s speaking the same language before diving into business process mapping.
Something I’ve noticed across industries with workflow automation, teams that skip this step waste weeks arguing about what the process even is. That argument should take 90 minutes on a whiteboard, not three months in a committee.
SIPOC can also clarify questions that teams have been avoiding:
- Who actually supplies the inputs for this process?
- What requirements should those inputs meet?
- Who benefits from the outputs?
- What do those recipients need the outputs to look like?
So if you’re planning any kind of automation — AI-driven or otherwise — a SIPOC diagram is the cheapest insurance policy you’ll ever buy.

How to build a SIPOC diagram step by step
Source: sipoc.info
The structure is dead simple. Five columns. That’s it. Label them Suppliers, Inputs, Process, Outputs, and Recipients. You can draw it on a whiteboard, use a spreadsheet, or download a template online.
Once you’ve got the grid, here’s how to fill it out.
Start with the process itself
Write the name of the process in the middle column and list its key steps. You can number them or sketch a quick flowchart — whatever makes it easier to follow. A few things to keep in mind:
- Know the exact starting and ending points. If you don’t, the other four columns will be a mess.
- Don’t go too deep. SIPOC is a birds-eye map. No decision points, no feedback loops, no exception handling.
Here’s something that trips up a lot of teams: they build their SIPOC from a conference room whiteboard session without ever watching the work happen. Bad idea. The Japanese call this “going to the Gemba” — physically showing up where work gets done. What people describe in meetings rarely matches reality. I’ve seen process steps that officially take “about an hour” actually consume entire afternoons because of undocumented workarounds.
Another technique worth trying is “process stapling” — you metaphorically staple yourself to a piece of work and follow it through every handoff, every queue, every touchpoint. Tedious? Yes. But it reveals the hidden detours and bottlenecks that never show up in official documentation.
Your SIPOC is only as accurate as your understanding of what actually happens, not what the procedure manual claims should happen.
Identify the outputs
Focus on the three to five main outputs. Use nouns. Keep the tone neutral — your goal isn’t to categorize outputs as good or bad. That comes later.
List the recipients
Who benefits from this process? These don’t have to be literal buyers. If you’re mapping an internal process, the recipients are your coworkers — the next department in the chain, the manager who needs the report, the team that inherits the deliverable.
Think about it this way: who would be upset if this process stopped running?
When doing research for this step, try noting recipient requirements in the Output column too. It adds useful context.
Document the inputs
Write down what the process needs to function. Four to six main inputs is usually enough. Don’t try to capture every sticky note and email — just the core materials, information, or resources that make the process go.
Identify the suppliers
In the Suppliers column, match each input to whoever provides it. Pay attention to any supplier whose input has a direct impact on the quality of the output. For example, if you’re mapping “Making tomato sauce” and a specific farm supplies the tomatoes, and tomato quality drives the taste variation — list that farm by name. Specificity matters.
Waste problem SIPOC makes visible
There’s a reason SIPOC deserves a spot early in any improvement project. It makes waste visible.
Once you’ve mapped out all five columns, you can start asking uncomfortable questions. Does this input add value, or is it there because “we’ve always collected it”? Are there outputs nobody uses? Is a supplier adding complexity without any corresponding benefit?
Lean practitioners talk about eight types of waste — waiting, overproduction, defects, overprocessing, and so on. A SIPOC won’t identify all of them, but it creates the foundation for that conversation. You can’t fix what you can’t see. And SIPOC forces the whole value stream onto a single page where problems become harder to ignore.
Based on hundreds of implementations, we’ve observed that teams who create a SIPOC before jumping into automation avoid roughly 40% of the rework they’d otherwise face. Why? Because they catch misaligned assumptions early — before those assumptions get baked into software.
From whiteboard to trackable workflow
Look, a SIPOC on a whiteboard is great for alignment. But it’s terrible for execution.
The diagram tells you what the process looks like. It doesn’t track whether anyone’s following it. It doesn’t alert you when a step is overdue. It doesn’t capture who did what and when.
That’s the whole reason Tallyfy exists. You start with that high-level map — your SIPOC — and then turn it into a living, trackable workflow where every step has an owner, a deadline, and a paper trail. Nobody reads documentation, but everybody follows a well-designed workflow when it shows up in their task list.
The pattern we keep running into about process documentation, one pattern keeps emerging: teams that rely on memory require employees to memorize 100+ process steps. A mid-size professional services firm told us their people were constantly asking colleagues where things stand because nothing was written down. SIPOC provides that essential first step toward fixing this chaos.
Common mistakes that ruin your SIPOC
I’ve seen teams mess this up in predictable ways. The first is going too granular. If your Process column has 25 steps, you’ve built a detailed process map — not a SIPOC. Keep it to 4-7 high-level steps. The second mistake is confusing outputs with outcomes. An output is something tangible the process produces — a report, a shipped order, an approved document. An outcome is the broader result — happier teams, faster turnaround, fewer errors. SIPOC cares about outputs.
The third mistake? Building it alone. A SIPOC created by one person in isolation is almost always wrong. The whole point is collaborative alignment. Get the people who actually do the work into the room. Their version of reality will surprise you.
When SIPOC isn’t enough
SIPOC is one of the oldest and most trusted ways to map a business process. It gives you a birds-eye overview that can help with onboarding, kickstarting improvement initiatives, or just getting everyone on the same page.
But it’s a starting point. Not a destination.
Once you’ve created your SIPOC, the next step is turning that high-level map into a repeatable, trackable workflow. These templates show what documented processes look like when they move beyond the whiteboard:
What busywork costs your company
per week
per year
over 5 years
