The swimlane diagram problem
Swimlane diagrams capture three dimensions most workflow tools miss: what needs doing, who does it, and when. A typical employee review takes 143 minutes of work spread across 17 business days and four departments. Tallyfy tracks all three at the template level so handoffs stay visible.
Swimlane diagrams capture what most workflow tools miss. Here’s how we approach workflow management.
Workflow Made Easy
Summary
Workflow swimlane diagram design - this is our personal, candid experience at Tallyfy. Not theory. The debate between BPMN complexity and checklist simplicity, and why we deliberately chose not to build swimlanes.
- Swimlane diagrams show what, who, and when - but most workflow tools only capture tasks and miss the critical ownership and timing dimensions
- Role-based assignment isn’t the same as groups - you know a PM will do a step, but not which PM until launch time
- 143 minutes across 17 business days - a typical employee review process spans four departments with handoffs that break without clear role visibility
- The placeholder problem - how do you assign someone you don’t know yet? See how Tallyfy handles role-based workflows
This reflects our experience at a specific point in time. Some details may have evolved since, and we’ve omitted certain private aspects that made the story equally interesting.
When I first started working on workflow software, I made a classic mistake. I thought the hard part was capturing the steps. It took years of building Tallyfy to realize the real problem is something different entirely.
The three dimensions problem
Here’s what our design discussions revealed. Back in April 2017, Pravina put it directly in one of our earliest architecture debates:
The above view shows just 1 element of a workflow: A. What needs to be done - Our Basics/Captures and Conditional Branching
It is missing: B. Who needs to do it - Owners C. When is needs to be done - Deadlines
Here is how all 3 elements are typically visualized today (swim lanes)
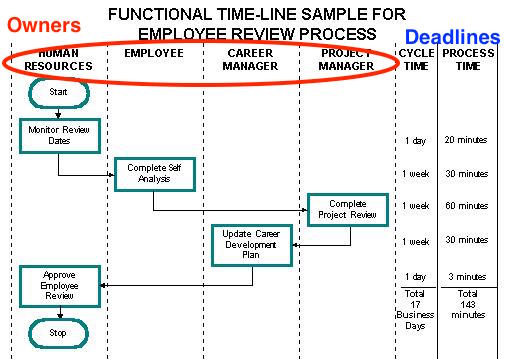
Look at that employee review process diagram. Four different roles. Seventeen business days of cycle time. But only 143 minutes of actual work. Turns out, the process isn’t slow because of the tasks. It’s slow because of the handoffs between Human Resources, the Employee, the Career Manager, and the Project Manager.
In discussions we have had with operations teams, this pattern appears constantly. A glass installation company we worked with had a 22-step process that spanned five departments - Customer Service, Estimating, Operations, Material Control, and Installation. The steps themselves were straightforward. The complexity was entirely in the handoffs. Their process documents looked clean on paper but broke down the moment work crossed departmental boundaries.
Most workflow tools would capture those six or seven steps. They would completely miss why the process takes so long.
Here’s a classic cross-functional swimlane from academia - a student registration process:
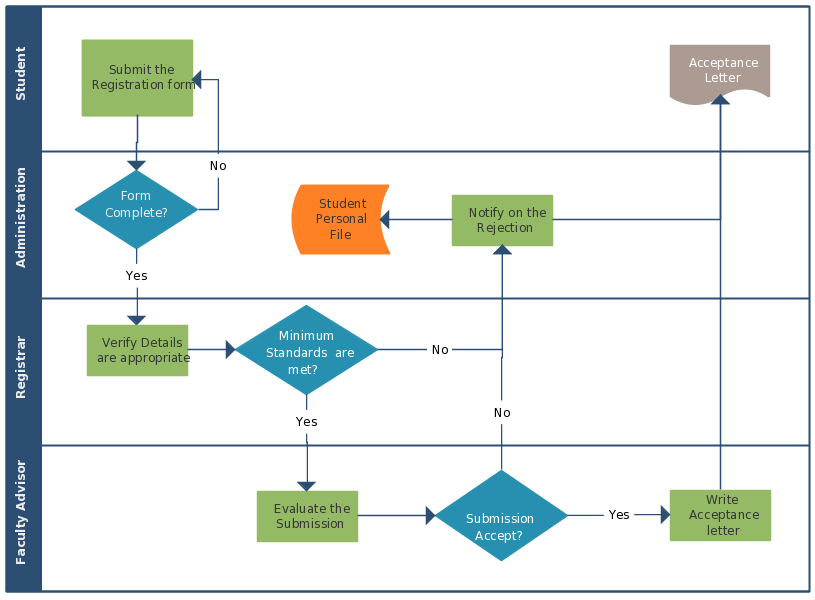
Four departments. Decision diamonds everywhere. Multiple endpoints. This is how process professionals think about work. But when they try to implement this in workflow software? They hit a wall.
Why swimlanes matter
I was pretty obsessed with visualization back in 2017. As I wrote in one design discussion:
Customers are thinking about processes visually, they always have. Given our strength is conditional branching - we need to come up with a view in builder that lets someone visualize the entire process flow - without actually doing flowcharts.
I posted an early sketch of how we thought about visualizing workflows:
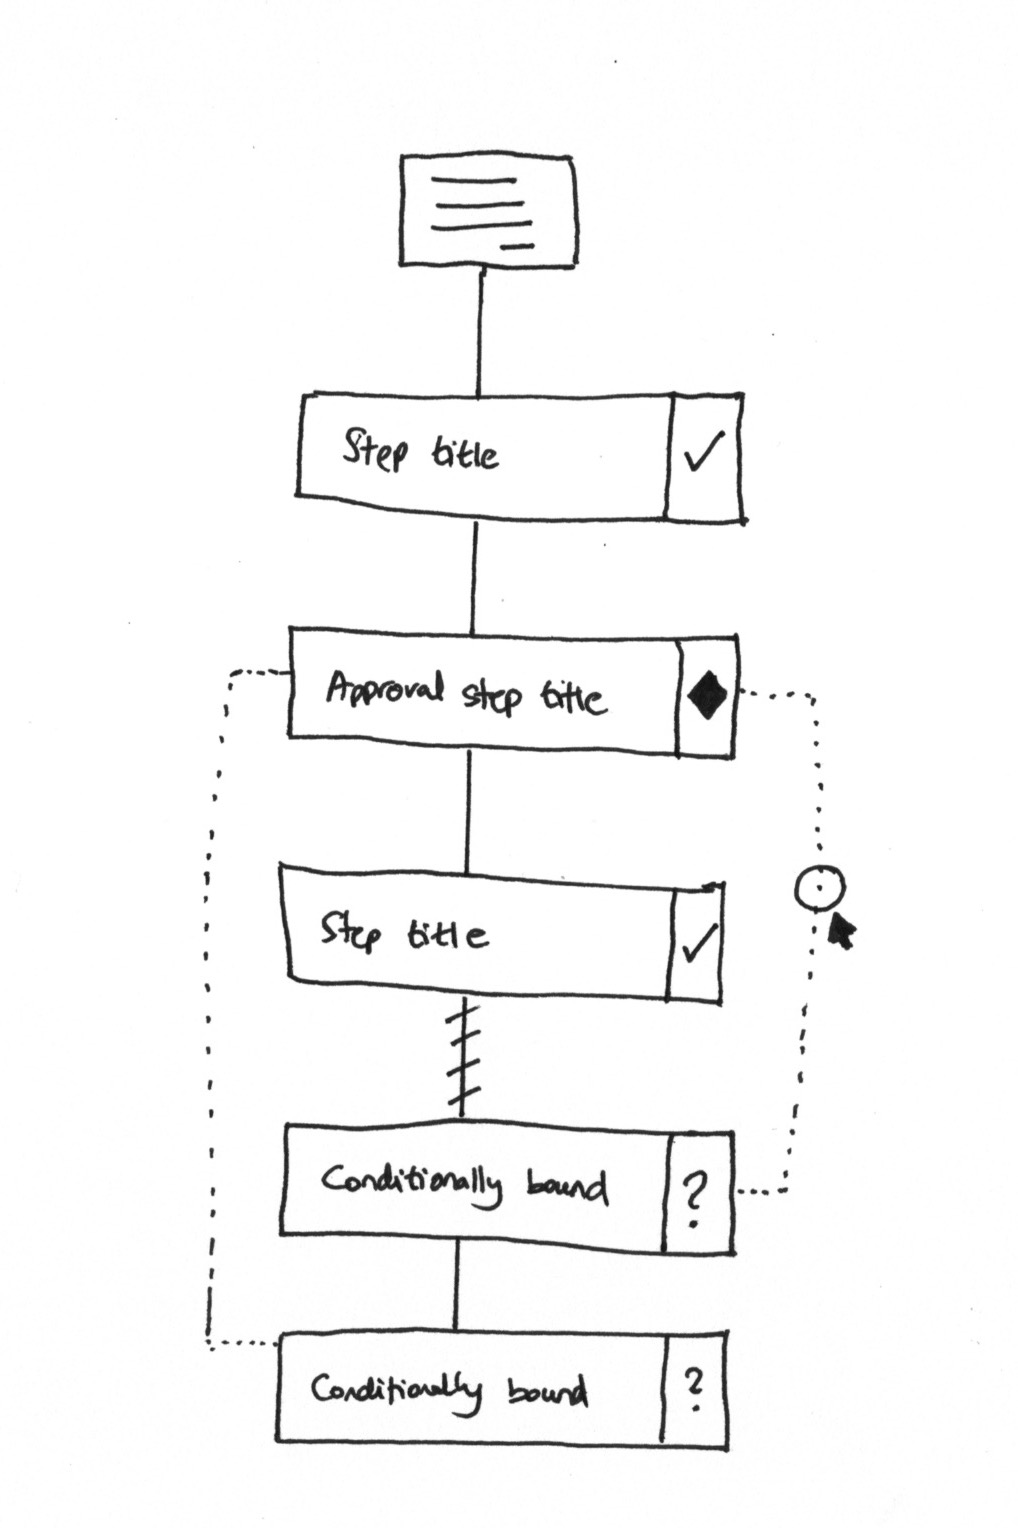
The idea was simple. Use familiar notation - diamonds for approvals, dotted lines for conditional branches. But when Pravina responded, she showed me what I was missing:
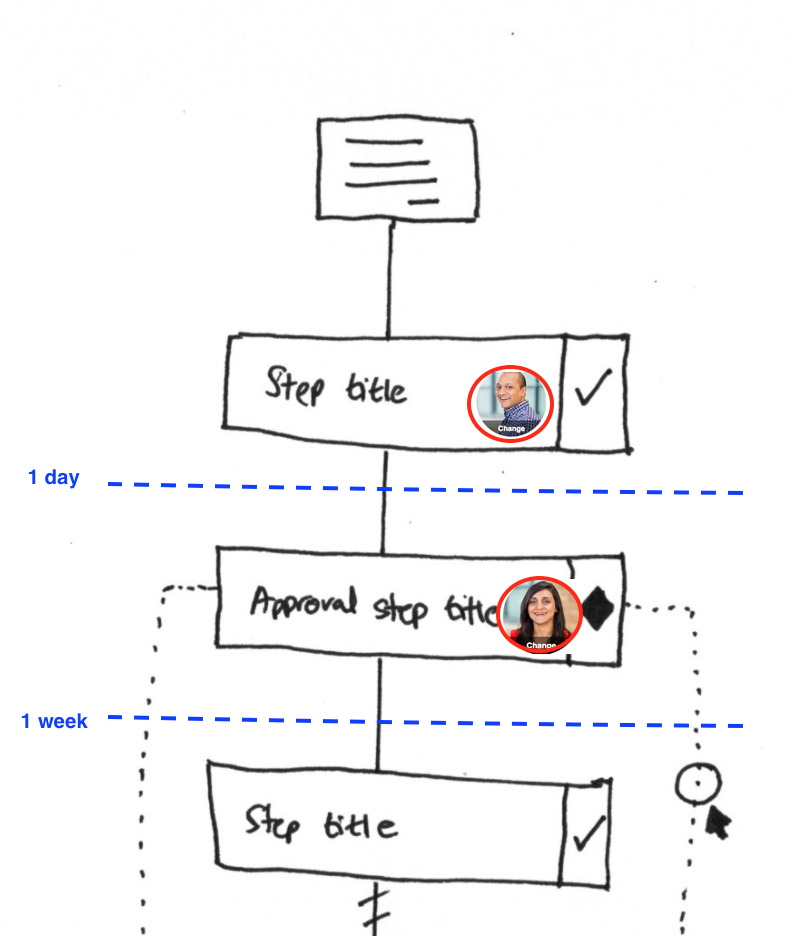
See the difference? Same steps. But now you can see who does each one and when. That “1 day” and “1 week” notation is everything. Without it, you’re tracking tasks, not tracking work.
Pravina pushed back on my original thinking:
We will need to incorporate all 3 elements into a mobile-friendly view.
She was right. We couldn’t just bolt on owners and deadlines as an afterthought. They needed to be first-class citizens in our data model. The template system had to capture all three dimensions from the start. Could we have bolted it on later? No.
The role assignment puzzle
This brings me to the real engineering challenge we faced. As I wrote in our internal design spec:
The use case for role-based assignment is simple.
In a blueprint, you do not know the exact people doing every step - but you know the role e.g. a PM will do this step, an architect will do this step, etc. In fact, typical swim lane diagrams actually express a process in that manner.
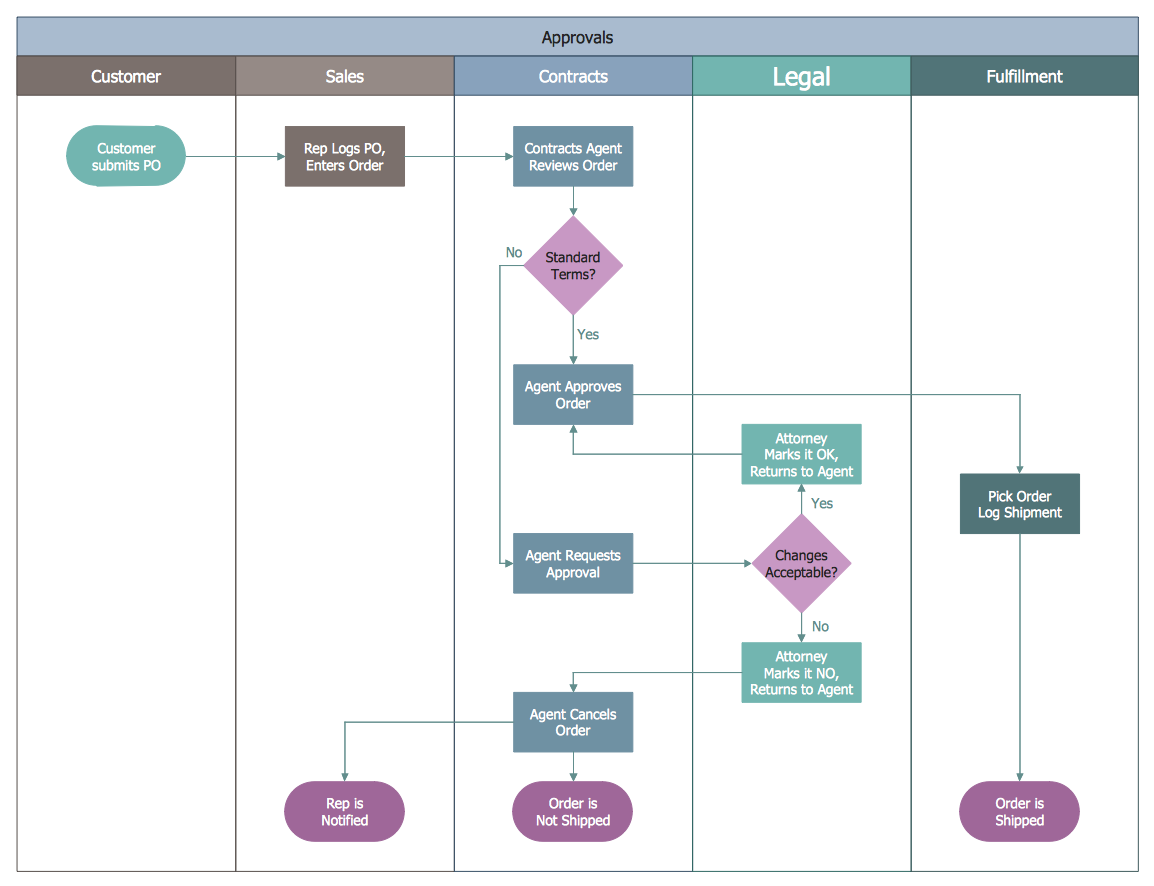
That approvals swimlane is a perfect example. Customer submits PO. Sales logs it. Contracts reviews. Legal checks. Fulfillment ships. Five different departments. But which specific person in Legal? You don’t know until the order comes in.
The pattern we keep running into is that most workflow software basically falls apart right here. They force you to either:
- Hard-code specific people (who might leave or be unavailable)
- Assign to a group (which creates “diffusion of responsibility”)
- Leave it blank and hope someone picks it up
None of those work for real operations. Ask anyone who’s tried.
Templates that handle role-based handoffs
See how Tallyfy captures the who along with the what
We heard this frustration directly from enterprise users. From a large enterprise real estate company:
Currently the process steps are being displayed linearly, but processes can be dynamic and non-linear. This linear workflow interface makes it difficult for users to build steps.
They were right. But I also knew the solution wasn’t to build a full flowchart editor. That path leads to complexity hell.
The debate we had
Our team had a genuine disagreement about how to solve this. Thomas, our designer, pushed back on adding another concept:
I am wondering if that adds complexity for the user.
Today users reach the assign tab and need to be informed we have:
- Hard coding assignees
- Assigning at launch
This would add a third, place holding assignees by work type which is essentially just 2, right?
He had a point. But I knew from customer conversations that mid-size companies needed something different:
The above is a valid user story though - as in mid-size cos - a department or team may have to be put in e.g. “A Project Manager” but not yet assigned.
This becomes doubly important in docs plan - since you will primarily think about the “role” that does the step, not the actual person, I presume.
The solution we landed on was what our Customer Success Manager suggested:
This could function like kickoff forms. In edit mode, you add custom roles, like you add kickoff forms, then when you click “assign” while editing a tasks, you can choose to assign one of the custom roles you chose, rather than a member.
Then when you launch a process, you fill out and assign a member to each role, much like filling out a custom field - except the ui will be like our member selection ui.
Simple. Treat roles like form fields. Define them in the template. Fill them in at launch.
Static groups versus dynamic roles
Pravina asked a clarifying question that helped sharpen our thinking:
My understanding that what you are referring to as ‘role’ is what we have mentioned to be ‘groups’ in the past. Please confirm.
My response captures the key distinction:
Groups are simply collections of people, so not dependent on roles/permissions in any way.
Note that these are dynamically assigned, so this is not the same as a group - where the people in a group e.g. “Cardinals fans” is essentially static/fixed.
This matters because:
- Groups = The same people every time (like “Marketing Team”)
- Roles = Different people each time (like “Project Manager for this specific project”)
For every process you launch - different people exist in each role:
- Process A - Project Manager > a project manager, another team member
- Process B - Project Manager > a designer, another team member, an engineer
That’s the messy real world. And swimlane diagrams capture it. Most workflow tools don’t.
A consulting firm we worked with ran employee onboarding processes that touched multiple people across HR, project leads, and the new hire themselves. Their process had 30-day, 60-day, and 90-day check-ins that each needed a different combination of Betty from HR, the project lead, and the candidate. The “Project Lead” role pointed to a different person for each client engagement. Static group assignment could never handle this.
The vision - making flowcharts obsolete
Here’s what drove our thinking. Back in October 2017, I wrote:
Our mission is to make that flowchart look “out of date”. Also - we are collecting sticky info like comments in our system, rendering the original flowchart a boring relic.
Traditional swimlane diagrams are static. They sit in Visio or Lucidchart. Nobody updates them.
The moment you run a real process, the diagram becomes fiction.
Our approach? Capture the structure once in a template, then let every running process be the source of truth. Comments, timestamps, who-did-what - all attached to the actual work, not some disconnected diagram.
I also wrote in an internal design doc:
We only show step title and icons against the steps to represent types e.g. approval steps would be diamond icons to keep this familiar with BPMN/UML.
We wanted the familiarity of flowcharts without the maintenance burden.
What we deliberately left out
There are several things we deliberately didn’t build that others might expect from swimlane-style visualization:
Full BPMN notation support: We explicitly rejected strict BPMN compliance. Gateways, events, pools, message flows. All that clunky notation adds complexity without adding value for most teams. As I wrote: “We never want to actually get into full-on flowcharts.”
This sentiment shows up constantly in developer communities:
In 99% of cases it’s a solution in search of a problem, peddled by an expensive consultant
BPMN might seem simple at first, but as your code base grows, it suddenly isn’t. YAGNI
Visual swimlane editor: We considered letting users draw swimlanes directly. Drag lanes, drop shapes, connect arrows. But we found that most processes don’t have clean enough branching to justify the complexity. That said, “most” is doing heavy lifting there. Linear with conditionals covers 90% of cases.
Drag-and-drop flowchart builder: Tools like Lucidchart and Visio let you create beautiful diagrams. But those diagrams don’t run. They don’t assign tasks. They don’t send reminders. We wanted executable processes, not documentation artifacts.
Automatic lane assignment: Some tools try to auto-assign based on workload balancing. We found this breaks down when domain expertise matters, which is most of the time.
Cross-process role persistence: We discussed letting roles carry over between processes (so “a project manager = Project Manager” would auto-fill). Decided against it because team structures change too often.
The goal was to solve the role-based handoff problem, not to rebuild Visio.
From an internal issue we logged:
We want something “in between” flowcharts and checklists to see a summary of all dependencies.
That middle ground is exactly what the tracker view delivers. You can see all dependencies without drawing boxes and arrows.
The focused view philosophy
One more design principle guided us. As I wrote during these discussions:
I think we should focus on specific views and get them right and perhaps not try to bundle task status, timeline and person responsible into a single grid.
That’s exactly what we did. Instead of one god-view that tries to show everything:
- Template view shows structure and assignments
- Tracker view shows status and bottlenecks
- Timeline view shows deadlines and delays
- Activity view shows who did what when
Each view does one thing well. Together, they give you everything a swimlane diagram would, plus they’re live, not static documentation.
How this connects to process managers
If you’re a process manager trying to document how work flows through your organization, swimlane diagrams are probably already your mental model. The question is whether your workflow software supports that mental model or fights against it.
The Tallyfy template system treats roles as first-class citizens. You can define “Project Engineer” or “Client Success Manager” as placeholders, then fill in the actual people when you launch each process.
That employee review diagram - 143 minutes of work spread across 17 days and four departments? With role-based assignment, you can track exactly where it is, who has it, and why it’s stuck at the Career Manager step for three days when it should have taken 30 minutes.
That’s the swimlane problem solved.
Not by building better diagrams, but by making the diagrams unnecessary.
About the Author
Amit is the CEO of Tallyfy. He is a workflow expert and specializes in process automation and the next generation of business process management in the post-flowchart age. He has decades of consulting experience in task and workflow automation, continuous improvement (all the flavors) and AI-driven workflows for small and large companies. Amit did a Computer Science degree at the University of Bath and moved from the UK to St. Louis, MO in 2014. He loves watching American robins and their nesting behaviors!
Follow Amit on his website, LinkedIn, Facebook, Reddit, X (Twitter) or YouTube.

Automate your workflows with Tallyfy
Stop chasing status updates. Track and automate your processes in one place.