SaaS (Software as a Service) has transformed into an important part of how modern businesses function. The growth rate of SaaS businesses is estimated to reach 21.2% until 2023. With so many of them popping up, realizing how to grow your SaaS business utilizing appropriate methods and metrics becomes essential.
Because of the nature of SaaS, you can’t rely on accounting metrics such as simple return on investment or traditional key performance indicators. Through SaaS, revenue comes from monthly or yearly subscriptions, therefore in periodic chunks over an extended period of time, also called the customer lifetime (more on how to use customer lifetime metrics for growth below
For your SaaS business to grow, your customers have to be satisfied with your service for an extended period of time. You also need to put constant efforts into SaaS marketing.
This article will cover the most important metrics that will help you identify the performance indicators that matter and will help you achieve that long term success. Amongst others, you will read about:
Three ways to succeed in SaaS
Nine business SaaS metrics which will help you grow your SaaS business, complimented with possible business scenarios and appropriate graphs
How to use these SaaS metrics to drive business growth
Three Ways to Succeed in SaaS
As mentioned before, the success of your SaaS business will vary on the benefits your consumers will reap from your service over time. Thus, simply making a sale or getting your customer on board is not enough. After acquiring the customer, you must make sure to maximize the customer lifetime value (LTV). The LTV is a fancy term for a metric that represents the total net profit your company makes from a certain customer. You are looking to augment the CLV by widening the ways and volumes you monetize your customers.
Simply put, to succeed in SaaS you must:
Sign up as many customers as you can.
Make sure they are loyal to your service.
Find ways to maximize profits from each individual customer.
However, this is easier said than done. What’s even more difficult is measuring your success and figuring out whether your efforts and tactics are going towards the right resources and consumers. The cash flow explanation and metrics below aim to help you understand more about how your SaaS business functions and which areas you can exploit for growth.
You can read more on the Customer Lifecycle by following this complete guide.
Crunching SaaS Cash Flows
Before we move on to breaking down the metrics, you should realize a peculiarity with SaaS cash flows that needs over-emphasizing.
You will spend a lot of money to acquire your customer, and you will get your dollars back over a large turnover time.
SaaS businesses need patience, nurturing, and strategy to be successful.
Let’s say that you hypothetically spend $10,000 in sales, ads or other leads to acquire a customer in January and you charge a subscription fee of $1,000 per month for your service. (We are not interfering with gross margin percentages at this point for the sake of simplicity).
Your single customer cash flow for the year will look something like this:
Your cumulative cash flow, the amount of money you get from a single customer added up through time, also taking into account your initial investment will then take this form:
This picture tells you that your revenue for this single customer will increase over time. The turnover period for your initial investment to acquire the customer will be January through November. In December, you can see the graph display positive returns, roughly 11 months after acquiring the customer.
The logic behind this single customer graph can be applied to your entire customer base. If you invest a large, substantial amount of money in the beginning to acquire the customer, your business will turn profitable faster because it will be able to acquire a larger amount of customers which will, together, make for a shorter turnover period.
The importance of continuous investment in SaaS
A big mistake young SaaS businesses make at the tipping turnover stage is the urge to enjoy the profits once losses decline and stop investing. This is a big no-no!
The moment all goes well with your returns and you start getting your money’s worth is the time to re-invest that money into lead generation and hire a larger support and sales force. Hiring extra customer support not only addresses recruitment efforts but also enhances the satisfaction of current customers. But why?
The ultimate business goal for your SaaS should be to increase the rate of growth of your business. SaaS businesses by nature are perceived as an intricate “game of thrones”, where the game is to occupy as much market share as you possibly can.
You want your SaaS business to be sitting in the throne as the market leader with all competitors left behind. The more you invest then re-invest, the more you grow, the larger your market share is, and the more profitable you are in the long run.
9 SaaS Metrics to Grow Your Business
Investing and reinvesting in lead generation is one of the most essential parts of any SaaS business. You can count on the metrics analyzed below to determine the health of your business and whether the types of leads and types of customers you are investing in will bring you long term profit.
The Rule of 40%
The method of 40% is a nice rule of thumb to use to determine whether or not you are operating a healthy SaaS business. The general practice of the rule of 40% ties in the essential SaaS relationship between growth rate and profit. In a nutshell, the sum of your growth rate (as a percentage) with your profit (as a percentage) should be equal to 40%.
For example, your SaaS business is healthy if you have a 30% growth rate and a 10% profit. Alternatively, you could have a 50% growth rate and a negative 10% profit, or a negative 20% growth rate but a 60% profit. This rule plays out on the concept that a SaaS business has to be constantly investing in new leads through acquired cash flows to earn more market share.
You can measure the market growth rate for your business easily, by expressing the difference between your current number of customers with the number of customers your firm had on the previous accounting period as a percentage. The profit percentage is a bit trickier to account for since different firms use different measures for profit. These vary from EBITDA to net income to available cash flow.
Use your own accounting metrics to determine your growth and profit but as a general rule of thumb, their sum should be roughly equal to 40%. If it is less or more than 40%, you should look as to where the mishaps are – you are either not investing enough of the profits you are acquiring or your turnaround on your investment is not satisfying.
The following SaaS metrics will help you determine what it is exactly you are doing right (in case of a rough 40% estimate) or where you’re messing up (in case of a different sum of the variables).
Customer Churn
One of the most important SaaS metrics to help you determine whether your business is healthy or not is customer churn. Also referred to as customer attrition, it directly represents the number of customers that stop subscribing to your business over a specific period of time. In simpler words, customer churn refers to the number of customers who stop being your customers. Churn can be expressed in terms of the number of customers lost or in terms of revenue lost from the decrease in subscriptions.
Customer churn becomes more relevant as your SaaS business grows. When your business exhibits a 5% customer churn, this will have different implications at different phases of your business life cycle. When you’re just starting out and have 100 customers, a 5% customer churn means 5 customers are stopping subscriptions, whereas when you have 1000 customers, the number becomes larger and causes more cause for concern.
The intricacy in the latter case is caused by your larger inability to replace these customers. If the churn rate of your business is unusually high, then there should be a flaw within the product or service you are offering. A high churn rate should be a great cause of concern.
Your ultimate goal as a SaaS business should be to get negative churn. In this ideal case, your revenue expansion from existing customers is larger than the lost revenue from churning customers. There are two ways you can strive for negative churn:
Use a variable pricing scheme. Charge your customers on a per-employee, per-seat, or any per-additional variable basis. When your customer grows their business, they will end up spending more on the subscription for your SaaS.
Upsell or cross-sell additional services to your current customers.
Cohort Analysis
A cohort is simply a fancy-sounding term for a group of customers your business acquired at the same time period. For example, all the customers you acquired during January will form the January cohort.
Cohort analysis is important to determine when you are losing the most customers, i.e. at what period of time your business is experiencing the largest churn rates. It can also help you figure out if the churn stabilizes after some period of time.
The graph below shows the performance of a cohort over a full year. The estimated customer churn is calculated at 5% for each month. The area in this chart is a great representation of the impact of the decrease in income that comes from customer churn in the profits of your business.
Predicting Customer Churn
As shown by simple graphs, the importance of customer churn can’t be undermined. If you only knew how to predict how many of your customers of a certain cohort would churn, you would be able to plan accordingly by recruiting other, more reliable customers! Well, in a way, you can.
The fewer features of your product or service a customer is using, the more likely it is that they will churn. They are not exploiting their subscription to a full extent, therefore, psychologically, they are losing less if they decide to cancel their subscription or stop their free trial.
One way you can determine who these customers are is by scoring different featuresof your SaaS in terms of “level of risk to churn” and tracking which customers are riskier. By creating a customer engagement score for different prediction indicators, you can protect your churn rates and rate your customers from most likely to least likely to churn, allowing you to plan accordingly.
Unit Economics Metrics
Unit economics is an educated term used when business metrics such as revenue or cost are expressed on a per unit basis. They usually help you analyze the long term profitability of your SaaS business. On this section, we will look at two of the most important customer unit economics metrics: Customer Lifetime Value and Cost to Acquire Customer and how you can use them to make decisions that impact your SaaS business.
Customer Lifetime Value (LTV)
We already defined customer lifetime value as a metric that represents the total net profit your company makes from a certain customer.
Mathematically, LTV it is expressed as 1 over the consumer churn rate. From your early knowledge in calculus, you will probably recall this being visualized as a hyperbola with diminishing returns (y-axis).
What this formula tells you is that an initial cohort in January with 1000 customers, when applied with a 5% churn rate, will start diminishing with time. Graphically, this situation looks like the chart below:
Cost to Acquire Customer (CAC)
We also briefly mentioned CAC in previous sections as one of the major factors that contribute towards the success of a SaaS business. The cost to acquire a typical customer is usually higher than most newbies in SaaS think. It is calculated as:
Your CAC graph may take different shapes depending on the relationship between the cost of all sales to recruit customers and the number of customers brought on board. These customers are calculated as the new cohort. Below is just one example of a Cost to acquire customer/cohort graph:
How to use LTV and CAC
Now that you have a better understanding of how LTV and CAC are calculated and what they look like on a graph, it is time to see how you can use them to check up on the health of your business. There are two golden rules you should follow:
First, LTV should be at least three times larger than CAC for the CAC to be justified. [LTV > 3 x CAC]. Arranging the variables in a different way, we get that the ratio of LTV and CAC should be at least three [LTV/CAC > 3]. Graphically, the LTV/CAC ratio takes this form:
Second, CAC should take less than 12 months to recover, i.e. turnover period should be less than 12 months. The profitability of the business will likely suffer shortly, but this is entirely healthy, so you shouldn’t worry. Graphically, the months to recover CAC metric for a fictional non-healthy business would look like this:
These rules serve not only as a “health check” for your SaaS business, but also help you:
Make decisions about when to invest. If your metrics are within the guidelines of the Golden Rules, this is an indicator that your business is healthy and this is a good time to reinvest back into the business some of that hard-earned cash
Evaluate lead sources. If the metrics are not within the guidelines, this says a lot about the quality of your investments in lead generation. You can now determine whether the lead sources and advert channels you have been using make sense financially for your business.
Segment your customers.The two golden rules also tell you which segments of your customers have a higher or faster LTV or CAC. You can do this by comparing how the rule applies to different cohorts or individual customers and then focus your sales and marketing efforts on targeting the most profitable segments.
Monthly and Yearly Recurring Revenue SaaS Metrics
Depending on how you run your SaaS business, your recurring revenue metrics might take one of the following three forms:
MRR (Monthly Recurring Revenue) – You will use this SaaS metric if you work with monthly contracts, i.e. charge your customers monthly, or the subscriptions are on a monthly basis.
ARR/ACV (Annual Recurring Revenue/Annual Contract Value) – You will use this metric if you work with annual contracts, i.e. charge your customers annually, or the subscriptions are on a yearly basis.
Although they are different in the way they are measured (per month or per year), these SaaS metrics are fundamentally measuring the same thing: revenue, and are subject to the same changes.
First, if there is a change in the number of new customers your business has taken in during a new month/year, there will be a new ARR/MRR.
Second, ARR/MRR will change if there is movement within the existing number of customers in your business.
Existing customers could cancel their subscription, which will lead to a churned ARR/MRR.
Existing customers could decide to renew or expand their subscription, which will lead to an expanded ARR/MRR.
Net New ARR/MRR
The metric you want to track when it comes to recurring revenue is the net new ARR/MRR. You can calculate this by adding up the number of new customers coming in (the new ARR/MRR) with the return from the customers who decided to renew their subscription (expanded ARR/MRR) and subtract the number of lost revenue from churning customers (churned ARR/MRR).
The dependency of net new ARR/MRR in the other variables is demonstrated best by the graph below.
Essentially, the plotting of net new ARR against new ARR, expanded ARR, and churned ARR gives you a full snapshot of your overall net revenue and what contributes towards its fluctuations.
Funnel Metrics
Funnel metrics are one of the most interesting forms of measuring the productivity and return of your leads and monitoring the customer recruitment process. The idea behind it is the listing of the lead generation and recruitment process in the shape of a funnel, where each step of the process measures:
The number of leads that went into that particular step
The conversion rate to the next step in the funnel
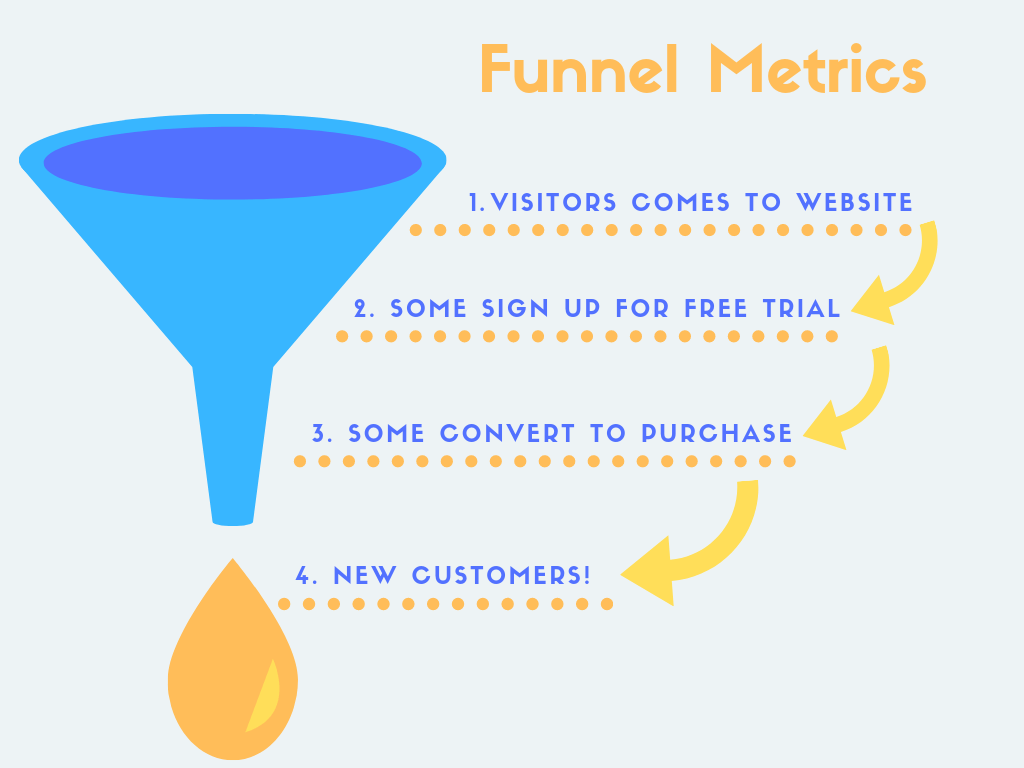
Funnel metrics and their large applicabilities are best demonstrated in practice. We are now using the example of our fictional business, which happens to have four steps in the customer onboarding process.
Step 1: Visitors come to our website.
Step 2: A portion of the visitors like the offer and sign up for a free trial.
Step 3: Some of the visitors who signed up for the free trial extended their demand by converting to purchase.
Step 4: These persons are now accounted for as new customers within your company.
Why Use Funnel Metrics?
Funnel metrics’ most obvious use is determining which leads/sources offer a larger amount of conversion rates. You can also observe where the bottlenecks in the customer onboarding process are if you think the number of new customers is not high enough. You will be able to identify a possible cause for the bottleneck. If the conversion rates from one step to the other are close to zero, then you have serious problems with lead generation and there are fundamental flaws in the design or functionality of your product or service.
Funnel metrics can also be used in the future planning process. Looking at your SaaS business’ current figures, you can go backward to reach a certain planned figure, thus reversing the steps.
For example, assume your funnel metrics consistently show that by spending $10,000 on Google Ads, you receive 200 new customers. Assume further that for the next period you plan to recruit 300 customers. Using the established funnel metrics method and rates of conversion, it will tell you that you need to spend roughly $15,000.
A funnel metrics process for our fictional business is given below. We have assumed our own conversion rates for each step to reach the final number of new customers recruited.
Conclusion
Being in the SaaS industry is now becoming more competitive than ever. With so many other SaaS businesses popping up, you need to know how to stay ahead of the game. In this article, we guided you through the basics of SaaS economics and financing and showed you nine different saas metrics you should use to keep track of the health of your business and determine how, where, and when to invest.
Start practicing the rules and tips we gave you while simultaneously improving and perfecting your product or business. Playing with SaaS metrics and maximizing lead generation will only get you so far. These metrics are just the tools in the financial/marketing toolbox to tinker your SaaS business. As such, they are far from enough for growing your Saas business to the nxt level.
After a certain point, retaining existing customers while getting new ones will become harder and harder. Things will be more difficult to scale, there will be a lot of menial tasks to iterate over and over again and so on. That seems unavoidable right? WRONG.
Nowadays, you can automate anything, literally ANYTHING. Starting from the most menial of tasks up to secretary level work which doesn’t require a human component anymore. The easiest way to grow your startup by automating most of your tasks is by using a Workflow and Business Process Management Software.
You get everything you need to be done, without you having to manually do it. As if a virtual secretary did it for you. You had to alert your new interns that after submitting their initial proposal drafts they must compose a 300-word recap? DONE. Alert management for the completion of the onboarding process? Also DONE.
If your employees’ work day is filled up with work that a virtual secretary could do, then give Tallyfy a try. It’s a beautiful workflow and business process management software that you can try for FREE, no credit card required. Right now!
And if you don’t like it, no worries, just let us know and we will get back to you with help and improvements.
Did you like this article? Do you think there is a metric that we missed?
Share your thoughts, questions, comments, and suggestions below.
Auto-document and track recurring workflows between people
Auto-document and track workflows with other people in real-time