

What is UML?
UML is an acronym that stands for Unified Modeling Language. Simply put, UML is a modern approach to modeling and documenting software. In fact, it’s one of the most popular business process modeling techniques. It is based on diagrammatic representations of software components. As the old proverb says: “a picture is worth a thousand words”. By using visual representations, we are able to better understand possible flaws or errors in software or business processes. UML was created as a result of the chaos revolving around software development and documentation. In the 1990s, there were several different ways to represent and document software systems. The need arose for a more unified way to visually represent those systems and as a result, in 1994-1996, the UML was developed by three software engineers working at Rational Software. It was later adopted as the standard in 1997 and has remained the standard ever since, receiving only a few updates.What is the use of UML?
Mainly, UML has been used as a general-purpose modeling language in the field of software engineering. However, it has now found its way into the documentation of several business processes or workflows. For example, activity diagrams, a type of UML diagram, can be used as a replacement for flowcharts. They provide both a more standardized way of modeling workflows as well as a wider range of features to improve readability and efficacy.What is Tallyfy?
Tallyfy helps you document and automate tasks between co-workers and clients
Click here to learn about Tallyfy UML itself finds different uses in software development and business process documentation:Sketch
UML diagrams, in this case, are used to communicate different aspects and characteristics of a system. However, this is only a top-level view of the system and will most probably not include all the necessary details to execute the project until the very end.- Forward Design – The design of the sketch is done before coding the application. This is done to get a better view of the system or workflow that you are trying to create. Many design issues or flaws can be revealed, thus improving the overall project health and well-being.
- Backward Design – After writing the code, the UML diagrams are drawn as a form of documentation for the different activities, roles, actors, and workflows.
Blueprint
In such a case, the UML diagram serves as a complete design that requires solely the actual implementation of the system or software. Often, this is done by using CASE tools (Computer Aided Software Engineering Tools). The main drawback of using CASE tools is that they require a certain level of expertise, user training as well as management and staff commitment.Pseudo Programming Language
UML is not a stand-alone programming language like Java, C++ or Python, however, with the right tools, it can turn into a pseudo programming language. In order to achieve this, the whole system needs to be documented in different UML diagrams and, by using the right software, the diagrams can be directly translated into code. This method can only be beneficial if the time it takes to draw the diagrams would take less time than writing the actual code. Despite UML having been created for modeling software systems, it has found several adoptions in business fields or non-software systems. Practical Example
One practical adoption would be to visually represent the process flow for telesales through an activity diagram. From the point in which an order is taken as an input, to the point where the order is completed and a specific output is given.
Types of UML Diagrams
There are several types of UML diagrams and each one of them serves a different purpose regardless of whether it is being designed before the implementation or after (as part of documentation). The two most broad categories that encompass all other types are Behavioral UML diagram and Structural UML diagram. As the name suggests, some UML diagrams try to analyze and depict the structure of a system or process, whereas other describe the behavior of the system, its actors, and its building components. The different types are broken down as follows:Behavioral UML Diagram
- Activity Diagram
- Use Case Diagram
- Interaction Overview Diagram
- Timing Diagram
- State Machine Diagram
- Communication Diagram
- Sequence Diagram
Structural UML Diagram
- Class Diagram
- Object Diagram
- Component Diagram
- Composite Structure Diagram
- Deployment Diagram
- Package Diagram
- Profile Diagram
Activity Diagram
Activity diagrams are probably the most important UML diagrams for doing business process modeling. In software development, it is generally used to describe the flow of different activities and actions. These can be both sequential and in parallel. They describe the objects used, consumed or produced by an activity and the relationship between the different activities. All the above are essential in business process modeling.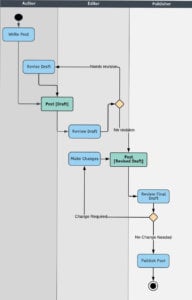
Are you thinking of using Microsoft Flow to try and run approval workflows? Think again – you will need something a lot easier for business users .
Use Case Diagram
A cornerstone part of the system is the functional requirements that the system fulfills. Use Case diagrams are used to analyze the system’s high-level requirements. These requirements are expressed through different use cases. We notice three main components of this UML diagram:- Functional requirements – represented as use cases; a verb describing an action
- Actors – they interact with the system; an actor can be a human being, an organization or an internal or external application
- Relationships between actors and use cases – represented using straight arrows

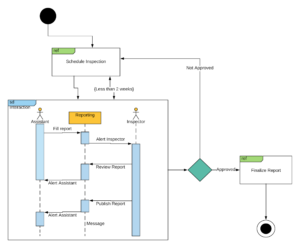
Interaction Overview Diagram
Interaction Overview UML diagrams are probably some of the most complex ones. So far we have explained what an activity diagram is. Additionally, within the set of behavioral diagrams, we have a subset made of four diagrams, called Interaction Diagrams:- Interaction Overview Diagram
- Timing Diagram
- Sequence Diagram
- Communication Diagram
Check out our complete guide on SaaS metrics to boost your business to the enxt level
Timing diagram
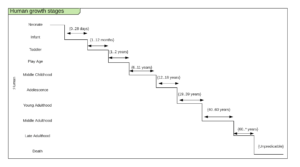
Timing UML diagrams are used to represent the relations of objects when the center of attention rests on time. We are not interested in how the objects interact or change each other, but rather we want to represent how objects and actors act along a linear time axis. Each individual participant is represented through a lifeline, which is essentially a line forming steps since the individual participant transits from one stage to another.The main focus is on time duration of events and the changes that occur depending on the duration constraints. The main components of a timing UML diagram are:- Lifeline – individual participant
- State timeline – a single lifeline can go through different states within a pipeline
- Duration constraint – a time interval constraint that represents the duration of necessary for a constraint to be fulfilled
- Time constraint – a time interval constraint during which something needs to be fulfilled by the participant
- Destruction occurrence – a message occurrence that destroys the individual participant and depicts the end of that participant’s lifeline
State Machine UML diagram
State machine UML diagrams, also referred to as Statechart diagrams, are used to describe the different states of a component within a system. It takes the name state machine because the diagram is essentially a machine that describes the several states of an object and how it changes based on internal and external events. A very simple state machine diagram would be that of a chess game. A typical chess game consists of moves made by White and moves made by Black. White gets to have the first move and thus initiates the game. The conclusion of the game can occur regardless of whether it is the White’s turn or the Black’s. The game can end with a checkmate, resignation or in a draw (different states of the machine).
Sequence UML Diagram
Sequence diagrams are probably the most important UML diagrams among not only the computer science community but also as design-level models for business application development. Lately, they have become popular in depicting business processes, because of their visually self-explanatory nature. As the name suggests, sequence diagrams describe the sequence of messages and interactions that happen between actors and objects. Actors or objects can be active only when needed or when another object wants to communicate with them. All communication is represented in a chronological manner. To get a better idea, check the example of a UML sequence diagram below. As the name suggests, structural diagrams are used to depict the structure of a system. More specifically, it is used in software development to represent the architecture of the system and how the different components are interconnected (not how they behave or communicate, simply where they stand). Below you can see an example of a sequence diagram, depicting a course registration system.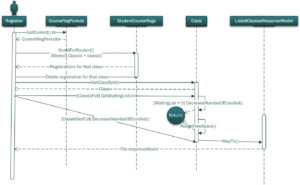
Communication UML diagram
In UML 1.x, communication diagrams used to be called collaborative diagrams. As the name suggests, the main focus of this type of UML diagram is on communication between objects. Since the core components are the messages that are exchanged between objects, we can build communication diagrams the same way we would make a sequence diagram. The only difference between the two is that objects in communication diagrams are shown with association connections. Visually, the two differ in that sequence diagrams are well-structured vertically and the message flow follows a top-down chronological approach. Communication UML diagrams on the other hand use number schemes and pointing arrows in order to depict the message flow. If you would have to choose between the two when writing documentation for a process or system, sequence diagrams would probably be a better choice. Many software engineers prefer sequence diagrams not only because they are better structured, but also because they have been given more attention in terms of the available annotations within the UML documentation. On the other hand, communication diagrams are much easier to design because you can literally add an object anywhere on the drawing board. After all, in order for objects to be connected, they only need to be part of the numbered sequence, without having to be physically close to each other. Below we are analyzing sequence diagrams. If you would like to read more about the differences between communication and sequence diagrams, you can read up on it here.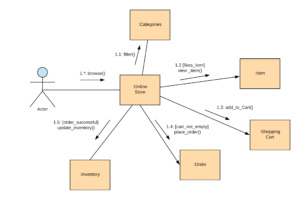
Class Diagram
Class UML diagram is the most common diagram type for software documentation. Since most software being created nowadays is still based on the Object-Oriented Programming paradigm, using class diagrams to document the software turns out to be a common-sense solution. This happens because OOP is based on classes and the relations between them. In a nutshell, class diagrams contain classes, alongside with their attributes (also referred to as data fields) and their behaviors (also referred to as member functions). More specifically, each class has 3 fields: the class name at the top, the class attributes right below the name, the class operations/behaviors at the bottom. The relation between different classes (represented by a connecting line), makes up a class diagram.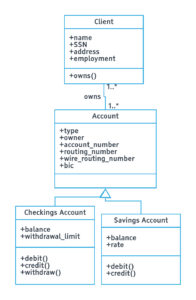
Object Diagram
When we discuss structural UML diagrams, we have no choice but to delve deeper into computer science-related concepts. In software development, Classes are considered abstract data types, whereas objects are instances of the abstract class. For example, if we have a class “Car” which is a generic abstract type, then an instance of the class “Car” would be an “Audi”. Object UML diagrams help software developers check whether the generic abstract structure that they have created (class diagram), represents a viable structure when put into practice, i.e: when the objects of a class are instantiated. Some developers see it as a secondary level of accuracy checking.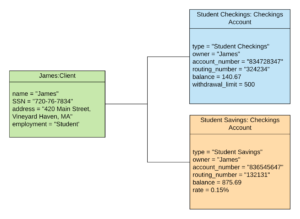
Component Diagram
When dealing with documentation of complex systems, component UML diagrams can help break down the system into smaller components. Sometimes it is hard to depict the architecture of a system because it might encompass several departments or it might employ different technologies. For example, Lambda architecture is the typical example of a complex architecture that can be represented using a component UML diagram. Lambda architecture is a data-processing architecture employed by several companies for storing and processing data in a distributed system. It is made up of three different layers: the speed layer, the batch layer and the serving one.
Composite Structure Diagram
This type of UML diagram is not commonly used because its function is very specific. It only represents the internal structure of a class and the relations between different class components. Business professionals are not generally interested in composite structure diagrams because their main focus is on the top level view of components and how they communicate with one the other. It is almost irrelevant for a manager to know how a specific data member of a class is related to a data member of another class. Below, you can find a simplified example for getting a general idea of how it looks.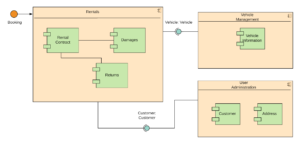
Deployment Diagram
Deployment diagrams are used to visualize the relation between software and hardware. To be more specific, with deployment diagrams we can construct a physical model of how software components (artifacts) are deployed on hardware components, known as nodes. A typical simplified deployment diagram for a web application would include:- Nodes (application server and database server)
- Artifacts (application client and database schema
Package Diagram
The package diagram is like a macro container for deployment UML diagrams that we explained above. Different packages contain nodes and artifacts. They organize the model diagrams and components into groups, the same way a namespace encapsulates different names that are somewhat interrelated. Ultimately a package can also be constructed by several other packages in order to depict more complex systems and behaviors. The main purpose of a package diagram is to show the relations between the different large components that make up a complex system. Programmers find this abstraction opportunity a good advantage for using package diagrams, especially when some details can be left out of the big picture.Profile Diagram
Profile diagram is not the typical UML diagram type. In fact, it can be regarded more as an extensibility mechanism rather than a diagram type like any other. With the use of stereotypes, tagged values, and constraints, you can extend and customize already existing UML notations. Profile diagrams are like a language, if you speak English you can create new sentences, and if you speak profile diagrams, well, then you can create new properties and semantics for UML diagrams.- Stereotypes – are used for extending the available UML elements. They allow you to create, edit or derive a new element or building block which can then be directly used in a diagram.
- Tagged values – think of this as adding new attributes to already existing models. A new tagged value will result respectively in a new keyword.
- Constraints – the word is self-explanatory, however, think of constraints as new conditions that you can add to your diagrams. For example, a constraint could be: “the outstanding balance must be greater than $3”. This constraint can be used to control when a checkings account should be terminated by the bank’s system.
Still confused on what UML diagrams are and what their use is? Check out our video: UML Diagrams and What They’re Used For
Tools for drawing UML Diagrams
Just like any other thing in life, in order to get something done properly, you need the right tools. For documenting software, processes or systems, you need the right tools that offer UML annotations and UML diagram templates. There are different software documentation tools that can help you draw a UML diagram. They are generally divided into these main categories:- Paper and pen – this one is a no-brainer. Pick up a paper and a pen, open up a UML syntax cheatsheet from the web and start drawing any diagram type you need
- Online tools – there are several online applications that can be used to draw a UML diagram. Most of them offer free trials or a limited number of diagrams on the free tier. If you are looking for a long-term solution for drawing UML diagrams, it is generally more beneficial to buy a premium subscription for one of the applications.
- Free Online Tools – these do pretty much the same thing that the paid ones do. The main difference is that the paid ones also offer tutorials and ready-made templates for specific UML diagrams. A great free tool is draw.io.
- Desktop application – a typical desktop application to use for UML diagrams and almost any other sort of diagram is Microsoft Visio. It offers advanced options and functionality. The only downside is that you have to pay for it.
Conclusion
As you might have noticed by now, using a UML diagram for documenting processes and systems can be very beneficial. The downside is that it can seem complex at first to draw one. You gotta learn the syntax, you need to choose which diagram out of the 14 different types is the most efficient for the job, etc.. However, once you start thinking in UML standards, you will get a better understanding of the process or system that you are mapping. Ultimately, it can help you discover flaws or possible optimizations that you might not have thought of before. We hope this article helped you get started with UML diagrams and how they can be used in a business environment. If you would like to add something to this post or if you feel like we might have missed something, let us know in the comments section below.Auto-document and track recurring workflows between people

Auto-document and track workflows with other people in real-time